APS 2012 Annual Report Download - page 87
Download and view the complete annual report
Please find page 87 of the 2012 APS annual report below. You can navigate through the pages in the report by either clicking on the pages listed below, or by using the keyword search tool below to find specific information within the annual report.-
 1
1 -
2
-
3
-
4
-
5
-
6
-
7
-
8
-
9
-
10
-
11
-
12
-
13
-
14
-
15
-
16
-
17
-
18
-
19
-
20
-
21
-
22
-
23
-
24
-
25
-
26
-
27
-
28
-
29
-
30
-
31
-
32
-
33
-
34
-
35
-
36
-
37
-
38
-
39
-
40
-
41
-
42
-
43
-
44
-
45
-
46
-
47
-
48
-
49
-
50
-
51
-
52
-
53
-
54
-
55
-
56
-
57
-
58
-
59
-
60
-
61
-
62
-
63
-
64
-
65
-
66
-
67
-
68
-
69
-
70
-
71
-
72
-
73
-
74
-
75
-
76
-
 77
77 -
 78
78 -
 79
79 -
 80
80 -
 81
81 -
 82
82 -
 83
83 -
 84
84 -
 85
85 -
 86
86 -
 87
87 -
 88
88 -
 89
89 -
 90
90 -
 91
91 -
 92
92 -
 93
93 -
 94
94 -
 95
95 -
 96
96 -
 97
97 -
98
-
99
-
100
-
101
-
102
-
103
-
104
-
105
-
106
-
107
-
108
-
109
-
110
-
111
-
112
-
113
-
114
-
115
-
116
-
117
-
118
-
119
-
120
-
121
-
122
-
123
-
124
-
125
-
126
-
127
-
128
-
129
-
130
-
131
-
132
-
133
-
134
-
135
-
136
-
137
-
138
-
139
-
140
-
141
-
142
-
143
-
144
-
145
-
146
-
147
-
148
-
149
-
150
-
151
-
152
-
153
-
154
-
155
-
156
-
157
-
158
-
159
-
160
-
161
-
162
-
163
-
164
-
165
-
166
-
167
-
168
-
169
-
170
-
171
-
172
-
173
-
174
-
175
-
176
-
177
-
178
-
179
-
180
-
181
-
182
-
183
-
184
-
185
-
186
-
187
-
188
-
189
-
190
-
191
-
192
-
193
-
194
-
195
-
196
-
197
-
198
-
199
-
200
-
201
-
202
-
203
-
204
-
205
-
206
-
207
-
208
-
209
-
210
-
211
-
212
-
213
-
214
-
215
-
216
-
217
-
218
-
219
-
220
-
221
-
222
-
223
-
224
-
225
-
226
-
227
-
228
-
229
-
230
-
231
-
232
-
233
-
234
-
235
-
236
-
237
-
238
-
239
-
240
-
241
-
242
-
243
-
244
-
245
-
246
-
247
-
248
-
249
-
250
-
251
-
252
-
253
-
254
-
255
-
256
 |
 |

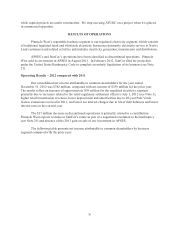
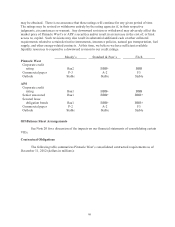
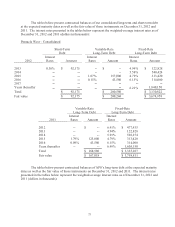
63
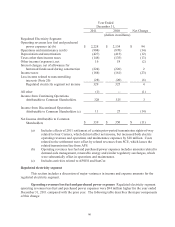
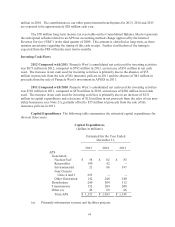
Pinnacle West Consolidated
2012
2011
2010
Net cash flow provided by operating activities
$ 1,171
$ 1,125
$ 750
Net cash flow used for investing activities
(873)
(782)
(576)
Net cash flow used for financing activities
(305)
(420)
(209)
Net decrease in cash and cash equivalents
$ (7) $ (77) $ (35)
Arizona Public Service Company
2012
2011
2010
Net cash flow provided by operating activities
$ 1,176
$ 1,128
$ 695
Net cash flow used for investing activities
(873)
(834)
(747)
Net cash flow provided by (used for) financing activities
(319)
(374)
31
Net decrease in cash and cash equivalents
$ (16) $ (80) $ (21)
Operating Cash Flows
2012 Compared with 2011 Pinnacle West’s consolidated net cash provided by operating
activities was $1,171 million in 2012, compared to $1,125 million in 2011, an increase of $46 million in
net cash provided. The increase is primarily related to a $77 million reduction of cash collateral posted
and a decrease of $23 million in cash paid for interest in the current year, partially offset by a $26
million increase in property tax payments, a $65 million pension contribution in 2012 (approximately
$12 million of which is reflected in capital expenditures) and other changes in working capital.
2011 Compared with 2010 Pinnacle West’s consolidated net cash provided by operating
activities was $1,125 million in 2011, compared to $750 million in 2010, an increase of $375 million in
net cash provided. The increase is primarily due to the $161 million change in collateral and margin
posted, as a result of changes in commodity prices and expiration of prior hedge contracts, and a $200
million voluntary pension contribution in 2010 (approximately $40 million of which is reflected in
capital expenditures). In addition, APS’s operating cash flows included income tax payments to the
parent company of approximately $81 million in 2010.
Other Pinnacle West sponsors a qualified defined benefit pension plan and a non-qualified
supplemental excess benefit retirement plan for the employees of Pinnacle West and our subsidiaries.
The requirements of the Employee Retirement Security Act of 1974 (“ERISA”) require us to contribute
a minimum amount to the qualified plan. We contribute at least the minimum amount required under
ERISA regulations, but no more than the maximum tax-deductible amount. The minimum required
funding takes into consideration the value of plan assets and our pension benefit obligations. Under
ERISA, the qualified pension plan was 105% funded as of January 1, 2012 and 101% funded as of
January 1, 2013. The assets in the plan are comprised of fixed-income, equity, real estate, and short-
term investments. Future year contribution amounts are dependent on plan asset performance and plan
actuarial assumptions. We made contributions to our pension plan totaling $65 million in 2012, zero in
2011 and $200 million in 2010. The minimum contributions for the pension plan due in 2013, 2014 and
2015 under the recently enacted Moving Ahead for Progress in the 21st Century Act (MAP-21) are
estimated to be zero, $89 million and $112 million, respectively. We expect to make voluntary
contributions totaling $140 million to the pension plan in 2013, and contributions up to approximately
$175 million in each of 2014 and 2015. With regard to contributions to our other postretirement benefit
plans, we made a contribution of approximately $23 million in 2012, $19 million in 2011, and $17