APS 2012 Annual Report Download - page 165
Download and view the complete annual report
Please find page 165 of the 2012 APS annual report below. You can navigate through the pages in the report by either clicking on the pages listed below, or by using the keyword search tool below to find specific information within the annual report.-
 1
1 -
 2
2 -
 3
3 -
 4
4 -
 5
5 -
 6
6 -
 7
7 -
 8
8 -
 9
9 -
 10
10 -
 11
11 -
 12
12 -
 13
13 -
 14
14 -
 15
15 -
 16
16 -
 17
17 -
 18
18 -
 19
19 -
 20
20 -
 21
21 -
 22
22 -
 23
23 -
 24
24 -
 25
25 -
 26
26 -
 27
27 -
 28
28 -
 29
29 -
 30
30 -
 31
31 -
 32
32 -
 33
33 -
 34
34 -
 35
35 -
 36
36 -
 37
37 -
 38
38 -
 39
39 -
 40
40 -
 41
41 -
 42
42 -
 43
43 -
 44
44 -
 45
45 -
 46
46 -
 47
47 -
 48
48 -
 49
49 -
 50
50 -
 51
51 -
 52
52 -
 53
53 -
 54
54 -
 55
55 -
 56
56 -
 57
57 -
 58
58 -
 59
59 -
 60
60 -
 61
61 -
 62
62 -
 63
63 -
 64
64 -
 65
65 -
 66
66 -
 67
67 -
 68
68 -
 69
69 -
 70
70 -
 71
71 -
 72
72 -
 73
73 -
 74
74 -
 75
75 -
 76
76 -
 77
77 -
 78
78 -
 79
79 -
 80
80 -
 81
81 -
 82
82 -
 83
83 -
 84
84 -
 85
85 -
 86
86 -
 87
87 -
 88
88 -
 89
89 -
 90
90 -
 91
91 -
 92
92 -
 93
93 -
 94
94 -
 95
95 -
 96
96 -
 97
97 -
 98
98 -
 99
99 -
 100
100 -
 101
101 -
 102
102 -
 103
103 -
 104
104 -
 105
105 -
 106
106 -
 107
107 -
 108
108 -
 109
109 -
 110
110 -
 111
111 -
 112
112 -
 113
113 -
 114
114 -
 115
115 -
 116
116 -
 117
117 -
 118
118 -
 119
119 -
 120
120 -
 121
121 -
 122
122 -
 123
123 -
 124
124 -
 125
125 -
 126
126 -
 127
127 -
 128
128 -
 129
129 -
 130
130 -
 131
131 -
 132
132 -
 133
133 -
 134
134 -
 135
135 -
 136
136 -
 137
137 -
 138
138 -
 139
139 -
 140
140 -
 141
141 -
 142
142 -
 143
143 -
 144
144 -
 145
145 -
 146
146 -
 147
147 -
 148
148 -
 149
149 -
 150
150 -
 151
151 -
 152
152 -
 153
153 -
 154
154 -
 155
155 -
 156
156 -
 157
157 -
 158
158 -
 159
159 -
 160
160 -
 161
161 -
 162
162 -
 163
163 -
 164
164 -
 165
165 -
 166
166 -
 167
167 -
 168
168 -
 169
169 -
 170
170 -
 171
171 -
 172
172 -
 173
173 -
 174
174 -
 175
175 -
 176
176 -
 177
177 -
 178
178 -
 179
179 -
 180
180 -
 181
181 -
 182
182 -
 183
183 -
 184
184 -
 185
185 -
 186
186 -
 187
187 -
 188
188 -
 189
189 -
 190
190 -
 191
191 -
 192
192 -
 193
193 -
 194
194 -
 195
195 -
 196
196 -
 197
197 -
 198
198 -
 199
199 -
 200
200 -
 201
201 -
 202
202 -
 203
203 -
 204
204 -
 205
205 -
 206
206 -
 207
207 -
 208
208 -
 209
209 -
 210
210 -
 211
211 -
 212
212 -
 213
213 -
 214
214 -
 215
215 -
 216
216 -
 217
217 -
 218
218 -
 219
219 -
 220
220 -
 221
221 -
 222
222 -
 223
223 -
 224
224 -
 225
225 -
 226
226 -
 227
227 -
 228
228 -
 229
229 -
 230
230 -
 231
231 -
 232
232 -
 233
233 -
 234
234 -
 235
235 -
 236
236 -
 237
237 -
 238
238 -
 239
239 -
 240
240 -
 241
241 -
 242
242 -
 243
243 -
 244
244 -
 245
245 -
 246
246 -
 247
247 -
 248
248 -
 249
249 -
 250
250 -
 251
251 -
 252
252 -
 253
253 -
 254
254 -
 255
255 -
 256
256
 |
 |

PINNACLE WEST CAPITAL CORPORATION
NOTES TO CONSOLIDATED FINANCIAL STATEMENTS
140
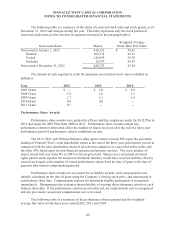
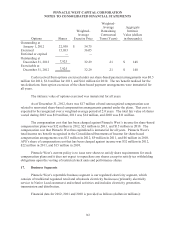
The following table is a summary of the status of restricted stock units and stock grants, as of
December 31, 2012 and changes during the year. This table represents only the stock portion of
restricted stock units, per the election on payment discussed in the paragraph above:
Nonvested shares
Shares
Weighted-Average
Grant-Date Fair Value
Nonvested at January 1, 2012
416,231
$ 39.61
Granted
202,278
49.31
Vested
126,959
39.76
Forfeited
10,797
42.63
Nonvested at December 31, 2012
480,753
43.58
The amount of cash required to settle the payments on restricted stock units is (dollars in
millions):
Year
2012
2011
2010
2007 Grant
$ --
$ 1.0
$ 0.9
2008 Grant
1.9
1.6
1.5
2009 Grant
1.7
1.5
1.4
2010 Grant
0.6
0.6
--
2011 Grant
0.7
--
--
Performance Share Awards
Performance share awards were granted to officers and key employees under the 2012 Plan in
2012 and under the 2007 Plan from 2008 to 2011. Performance share awards contain two
performance element criteria that affect the number of shares received after the end of a three-year
performance period if performance criteria conditions are met.
The 2012, 2011 and 2010 performance share grant criteria is based 50% upon the percentile
ranking of Pinnacle West’s total shareholder return at the end of the three-year performance period as
compared with the total shareholder return of all relevant companies in a specified utility index and
the other 50% based upon six non-financial separate performance metrics. The exact number of
shares issued will vary from 0% to 200% of the target award. Shares received include dividend
rights paid in stock equal to the amount of dividends that they would have received had they directly
owned stock equal to the number of vested performance shares from the date of grant to the date of
payment plus interest compounded quarterly.
Performance share awards are accounted for as liability awards, with compensation cost
initially calculated on the date of grant using the Company’s closing stock price, and remeasured at
each balance sheet date. Compensation expense for retirement eligible participants is recognized
immediately. Management also evaluates the probability of meeting the performance criteria at each
balance sheet date. If the performance criteria are not achieved, no compensation cost is recognized
and any previously recognized compensation cost is reversed.
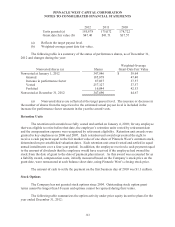
The following table is a summary of the performance shares granted and the weighted-
average fair value for the three years ended 2012, 2011 and 2010:
