APS 2012 Annual Report Download - page 157
Download and view the complete annual report
Please find page 157 of the 2012 APS annual report below. You can navigate through the pages in the report by either clicking on the pages listed below, or by using the keyword search tool below to find specific information within the annual report.-
 1
1 -
2
-
3
-
4
-
5
-
6
-
7
-
8
-
9
-
10
-
11
-
12
-
13
-
14
-
15
-
16
-
17
-
18
-
19
-
20
-
21
-
22
-
23
-
24
-
25
-
26
-
27
-
28
-
29
-
30
-
31
-
32
-
33
-
34
-
35
-
36
-
37
-
38
-
39
-
40
-
41
-
42
-
43
-
44
-
45
-
46
-
47
-
48
-
49
-
50
-
51
-
52
-
53
-
54
-
55
-
56
-
57
-
58
-
59
-
60
-
61
-
62
-
63
-
64
-
65
-
66
-
67
-
68
-
69
-
70
-
71
-
72
-
73
-
74
-
75
-
76
-
77
-
78
-
79
-
80
-
81
-
82
-
83
-
84
-
85
-
86
-
87
-
88
-
89
-
90
-
91
-
92
-
93
-
94
-
95
-
96
-
97
-
98
-
99
-
100
-
101
-
102
-
103
-
104
-
105
-
106
-
107
-
108
-
109
-
110
-
111
-
112
-
113
-
114
-
115
-
116
-
117
-
118
-
119
-
120
-
121
-
122
-
123
-
124
-
125
-
126
-
127
-
128
-
129
-
130
-
131
-
132
-
133
-
134
-
135
-
136
-
137
-
138
-
139
-
140
-
141
-
142
-
143
-
144
-
145
-
146
-
 147
147 -
 148
148 -
 149
149 -
 150
150 -
 151
151 -
 152
152 -
 153
153 -
 154
154 -
 155
155 -
 156
156 -
 157
157 -
 158
158 -
 159
159 -
 160
160 -
 161
161 -
 162
162 -
 163
163 -
 164
164 -
 165
165 -
 166
166 -
 167
167 -
168
-
169
-
170
-
171
-
172
-
173
-
174
-
175
-
176
-
177
-
178
-
179
-
180
-
181
-
182
-
183
-
184
-
185
-
186
-
187
-
188
-
189
-
190
-
191
-
192
-
193
-
194
-
195
-
196
-
197
-
198
-
199
-
200
-
201
-
202
-
203
-
204
-
205
-
206
-
207
-
208
-
209
-
210
-
211
-
212
-
213
-
214
-
215
-
216
-
217
-
218
-
219
-
220
-
221
-
222
-
223
-
224
-
225
-
226
-
227
-
228
-
229
-
230
-
231
-
232
-
233
-
234
-
235
-
236
-
237
-
238
-
239
-
240
-
241
-
242
-
243
-
244
-
245
-
246
-
247
-
248
-
249
-
250
-
251
-
252
-
253
-
254
-
255
-
256
 |
 |
PINNACLE WEST CAPITAL CORPORATION
NOTES TO CONSOLIDATED FINANCIAL STATEMENTS
132
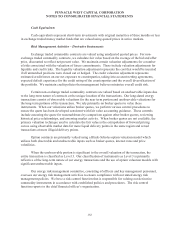
Cash Equivalents
Cash equivalents represent short-term investments with original maturities of three months or less
in exchange traded money market funds that are valued using quoted prices in active markets.
Risk Management Activities – Derivative Instruments
Exchange traded commodity contracts are valued using unadjusted quoted prices. For non-
exchange traded commodity contracts, we calculate fair value based on the average of the bid and offer
price, discounted to reflect net present value. We maintain certain valuation adjustments for a number
of risks associated with the valuation of future commitments. These include valuation adjustments for
liquidity and credit risks. The liquidity valuation adjustment represents the cost that would be incurred
if all unmatched positions were closed out or hedged. The credit valuation adjustment represents
estimated credit losses on our net exposure to counterparties, taking into account netting agreements,
expected default experience for the credit rating of the counterparties and the overall diversification of
the portfolio. We maintain credit policies that management believes minimize overall credit risk.
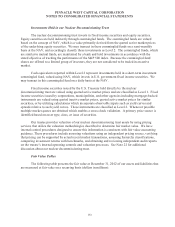
Certain non-exchange traded commodity contracts are valued based on unobservable inputs due
to the long-term nature of contracts or the unique location of the transactions. Our long-dated energy
transactions consist of observable valuations for the near term portion and unobservable valuations for
the long-term portions of the transaction. We rely primarily on broker quotes to value these
instruments. When our valuations utilize broker quotes, we perform various control procedures to
ensure the quote has been developed consistent with fair value accounting guidance. These controls
include assessing the quote for reasonableness by comparison against other broker quotes, reviewing
historical price relationships, and assessing market activity. When broker quotes are not available, the
primary valuation technique used to calculate the fair value is the extrapolation of forward pricing
curves using observable market data for more liquid delivery points in the same region and actual
transactions at more illiquid delivery points.
Option contracts are primarily valued using a Black-Scholes option valuation model which
utilizes both observable and unobservable inputs such as broker quotes, interest rates and price
volatilities.
When the unobservable portion is significant to the overall valuation of the transaction, the
entire transaction is classified as Level 3. Our classification of instruments as Level 3 is primarily
reflective of the long-term nature of our energy transactions and the use of option valuation models with
significant unobservable inputs.
Our energy risk management committee, consisting of officers and key management personnel,
oversees our energy risk management activities to ensure compliance with our stated energy risk
management policies. We have a risk control function that is responsible for valuing our derivative
commodity instruments in accordance with established policies and procedures. The risk control
function reports to the chief financial officer’s organization.