APS 2012 Annual Report Download - page 83
Download and view the complete annual report
Please find page 83 of the 2012 APS annual report below. You can navigate through the pages in the report by either clicking on the pages listed below, or by using the keyword search tool below to find specific information within the annual report.-
 1
1 -
2
-
3
-
4
-
5
-
6
-
7
-
8
-
9
-
10
-
11
-
12
-
13
-
14
-
15
-
16
-
17
-
18
-
19
-
20
-
21
-
22
-
23
-
24
-
25
-
26
-
27
-
28
-
29
-
30
-
31
-
32
-
33
-
34
-
35
-
36
-
37
-
38
-
39
-
40
-
41
-
42
-
43
-
44
-
45
-
46
-
47
-
48
-
49
-
50
-
51
-
52
-
53
-
54
-
55
-
56
-
57
-
58
-
59
-
60
-
61
-
62
-
63
-
64
-
65
-
66
-
67
-
68
-
69
-
70
-
71
-
72
-
 73
73 -
 74
74 -
 75
75 -
 76
76 -
 77
77 -
 78
78 -
 79
79 -
 80
80 -
 81
81 -
 82
82 -
 83
83 -
 84
84 -
 85
85 -
 86
86 -
 87
87 -
 88
88 -
 89
89 -
 90
90 -
 91
91 -
 92
92 -
 93
93 -
94
-
95
-
96
-
97
-
98
-
99
-
100
-
101
-
102
-
103
-
104
-
105
-
106
-
107
-
108
-
109
-
110
-
111
-
112
-
113
-
114
-
115
-
116
-
117
-
118
-
119
-
120
-
121
-
122
-
123
-
124
-
125
-
126
-
127
-
128
-
129
-
130
-
131
-
132
-
133
-
134
-
135
-
136
-
137
-
138
-
139
-
140
-
141
-
142
-
143
-
144
-
145
-
146
-
147
-
148
-
149
-
150
-
151
-
152
-
153
-
154
-
155
-
156
-
157
-
158
-
159
-
160
-
161
-
162
-
163
-
164
-
165
-
166
-
167
-
168
-
169
-
170
-
171
-
172
-
173
-
174
-
175
-
176
-
177
-
178
-
179
-
180
-
181
-
182
-
183
-
184
-
185
-
186
-
187
-
188
-
189
-
190
-
191
-
192
-
193
-
194
-
195
-
196
-
197
-
198
-
199
-
200
-
201
-
202
-
203
-
204
-
205
-
206
-
207
-
208
-
209
-
210
-
211
-
212
-
213
-
214
-
215
-
216
-
217
-
218
-
219
-
220
-
221
-
222
-
223
-
224
-
225
-
226
-
227
-
228
-
229
-
230
-
231
-
232
-
233
-
234
-
235
-
236
-
237
-
238
-
239
-
240
-
241
-
242
-
243
-
244
-
245
-
246
-
247
-
248
-
249
-
250
-
251
-
252
-
253
-
254
-
255
-
256
 |
 |

59
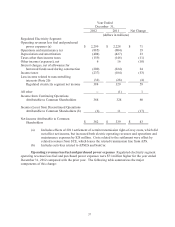
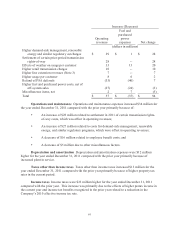
Taxes other than income taxes Taxes other than income taxes increased $11 million for the
year ended December 31, 2012 compared with the prior year primarily because of higher property tax
rates in the current year.
Other income (expenses), net Other income (expenses), net, decreased $10 million for the year
ended December 31, 2012 compared with the prior year primarily because of higher investment losses
of approximately $2 million and other non-operating expenses of approximately $8 million in the
current year.
Interest charges, net of allowance for borrowed funds used during construction Interest
charges, net of allowance for borrowed funds used during construction, decreased $24 million for the
year ended December 31, 2012 compared with the prior year primarily because of lower debt balances
and lower interest rates in the current year.
Income taxes Income taxes were $53 million higher for the year ended December 31, 2012
compared with the prior year primarily due to higher pre-tax income in the current year and a lower
effective tax rate in 2011.
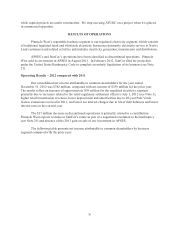
Discontinued Operations
Results from discontinued operations decreased $17 million primarily due to a contribution
Pinnacle West expects to make to SunCor’s estate as part of a negotiated resolution to the bankruptcy
(see Note 21) and absence of a gain related to the sale of our investment in APSES in 2011.
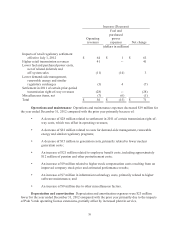
Operating Results – 2011 compared with 2010
Our consolidated net income attributable to common shareholders for the year ended
December 31, 2011 was $339 million, compared with net income of $350 million for the prior year.
The $11 million net decrease consisted of a $14 million decrease in income from discontinued
operations and a $3 million increase in income from continuing operations primarily related to the
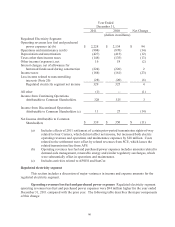
regulated electricity segment. Regulated electricity segment results reflect increased revenues related
to weather and higher retail transmission charges and decreased operations and maintenance expenses.
These positive factors were offset by higher depreciation and amortization due to increased plant in
service, higher property taxes due to increased property tax rates and higher income taxes, including
income tax benefits recognized in the prior year.
In addition, income from discontinued operations for the year ended December 31, 2011
included a gain of approximately $10 million after income taxes related to the sale of our investment in
APSES. Income from discontinued operations in the prior year was due to a $25 million gain after
income taxes related to the sale of APSES’s district cooling business (see Note 21).
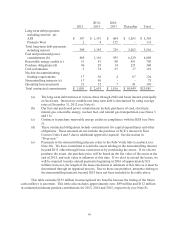
The following table presents net income attributable to common shareholders by business
segment compared with the prior year: