APS 2012 Annual Report Download - page 79
Download and view the complete annual report
Please find page 79 of the 2012 APS annual report below. You can navigate through the pages in the report by either clicking on the pages listed below, or by using the keyword search tool below to find specific information within the annual report.-
 1
1 -
2
-
3
-
4
-
5
-
6
-
7
-
8
-
9
-
10
-
11
-
12
-
13
-
14
-
15
-
16
-
17
-
18
-
19
-
20
-
21
-
22
-
23
-
24
-
25
-
26
-
27
-
28
-
29
-
30
-
31
-
32
-
33
-
34
-
35
-
36
-
37
-
38
-
39
-
40
-
41
-
42
-
43
-
44
-
45
-
46
-
47
-
48
-
49
-
50
-
51
-
52
-
53
-
54
-
55
-
56
-
57
-
58
-
59
-
60
-
61
-
62
-
63
-
64
-
65
-
66
-
67
-
68
-
 69
69 -
 70
70 -
 71
71 -
 72
72 -
 73
73 -
 74
74 -
 75
75 -
 76
76 -
 77
77 -
 78
78 -
 79
79 -
 80
80 -
 81
81 -
 82
82 -
 83
83 -
 84
84 -
 85
85 -
 86
86 -
 87
87 -
 88
88 -
 89
89 -
90
-
91
-
92
-
93
-
94
-
95
-
96
-
97
-
98
-
99
-
100
-
101
-
102
-
103
-
104
-
105
-
106
-
107
-
108
-
109
-
110
-
111
-
112
-
113
-
114
-
115
-
116
-
117
-
118
-
119
-
120
-
121
-
122
-
123
-
124
-
125
-
126
-
127
-
128
-
129
-
130
-
131
-
132
-
133
-
134
-
135
-
136
-
137
-
138
-
139
-
140
-
141
-
142
-
143
-
144
-
145
-
146
-
147
-
148
-
149
-
150
-
151
-
152
-
153
-
154
-
155
-
156
-
157
-
158
-
159
-
160
-
161
-
162
-
163
-
164
-
165
-
166
-
167
-
168
-
169
-
170
-
171
-
172
-
173
-
174
-
175
-
176
-
177
-
178
-
179
-
180
-
181
-
182
-
183
-
184
-
185
-
186
-
187
-
188
-
189
-
190
-
191
-
192
-
193
-
194
-
195
-
196
-
197
-
198
-
199
-
200
-
201
-
202
-
203
-
204
-
205
-
206
-
207
-
208
-
209
-
210
-
211
-
212
-
213
-
214
-
215
-
216
-
217
-
218
-
219
-
220
-
221
-
222
-
223
-
224
-
225
-
226
-
227
-
228
-
229
-
230
-
231
-
232
-
233
-
234
-
235
-
236
-
237
-
238
-
239
-
240
-
241
-
242
-
243
-
244
-
245
-
246
-
247
-
248
-
249
-
250
-
251
-
252
-
253
-
254
-
255
-
256
 |
 |
55
Weather. In forecasting the retail sales growth numbers provided above, we assume normal
weather patterns based on historical data. Historical extreme weather variations have resulted in annual
variations in net income in excess of $20 million. However, our experience indicates that the more
typical variations from normal weather can result in increases or decreases in annual net income of up to
$10 million.
Fuel and Purchased Power Costs. Fuel and purchased power costs included on our
Consolidated Statements of Income are impacted by our electricity sales volumes, existing contracts for
purchased power and generation fuel, our power plant performance, transmission availability or
constraints, prevailing market prices, new generating plants being placed in service in our market areas,
changes in our generation resource allocation, our hedging program for managing such costs and PSA
deferrals and the related amortization.
Operations and Maintenance Expenses. Operations and maintenance expenses are impacted
by growth, power plant operations, maintenance of utility plant (including generation, transmission, and
distribution facilities), inflation, outages, higher-trending pension and other postretirement benefit costs,
renewable energy and demand side management related expenses (which are offset by the same amount
of operating revenues) and other factors. In the settlement agreement related to the 2008 retail rate case,
APS committed to operational expense reductions from 2010 through 2014 and received approval to
defer certain pension and other postretirement benefit cost increases incurred in 2011 and 2012, which
totaled $25 million, as a regulatory asset, until the most recent general retail rate case decision became
effective on July 1, 2012. In July 2012, we began amortizing the regulatory asset over a 36-month
period.
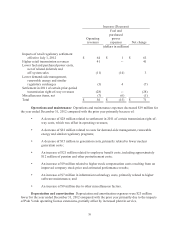
Depreciation and Amortization Expenses. Depreciation and amortization expenses are
impacted by net additions to utility plant and other property (such as new generation, transmission, and
distribution facilities), and changes in depreciation and amortization rates. See “Capital Expenditures”
below for information regarding the planned additions to our facilities. As a result of the twenty-year
extensions of the operating licenses for each of the Palo Verde units granted by the NRC in 2011, we
decreased our pretax depreciation expense related to Palo Verde by approximately $34 million per year
starting on January 1, 2012.
Property Taxes. Taxes other than income taxes consist primarily of property taxes, which are
affected by the value of property in-service and under construction, assessment ratios, and tax rates.
The average property tax rate in Arizona for APS, which owns essentially all of our property, was 9.6%
of the assessed value for 2012, 9.0% for 2011, and 8.0% for 2010. We expect property taxes to increase
as we add new generating units and continue with improvements and expansions to our existing
generating units, transmission and distribution facilities. (See Note 3 for property tax deferrals
contained in the Settlement Agreement).
Income Taxes. Income taxes are affected by the amount of pretax book income, income tax
rates, certain deductions and non-taxable items, such as AFUDC. In addition, income taxes may also be
affected by the settlement of issues with taxing authorities.
Interest Expense. Interest expense is affected by the amount of debt outstanding and the
interest rates on that debt (see Note 6). The primary factors affecting borrowing levels are expected to
be our capital expenditures, long-term debt maturities, equity issuances and internally generated cash
flow. An allowance for borrowed funds used during construction offsets a portion of interest expense