APS 2012 Annual Report Download - page 194
Download and view the complete annual report
Please find page 194 of the 2012 APS annual report below. You can navigate through the pages in the report by either clicking on the pages listed below, or by using the keyword search tool below to find specific information within the annual report.-
 1
1 -
2
-
3
-
4
-
5
-
6
-
7
-
8
-
9
-
10
-
11
-
12
-
13
-
14
-
15
-
16
-
17
-
18
-
19
-
20
-
21
-
22
-
23
-
24
-
25
-
26
-
27
-
28
-
29
-
30
-
31
-
32
-
33
-
34
-
35
-
36
-
37
-
38
-
39
-
40
-
41
-
42
-
43
-
44
-
45
-
46
-
47
-
48
-
49
-
50
-
51
-
52
-
53
-
54
-
55
-
56
-
57
-
58
-
59
-
60
-
61
-
62
-
63
-
64
-
65
-
66
-
67
-
68
-
69
-
70
-
71
-
72
-
73
-
74
-
75
-
76
-
77
-
78
-
79
-
80
-
81
-
82
-
83
-
84
-
85
-
86
-
87
-
88
-
89
-
90
-
91
-
92
-
93
-
94
-
95
-
96
-
97
-
98
-
99
-
100
-
101
-
102
-
103
-
104
-
105
-
106
-
107
-
108
-
109
-
110
-
111
-
112
-
113
-
114
-
115
-
116
-
117
-
118
-
119
-
120
-
121
-
122
-
123
-
124
-
125
-
126
-
127
-
128
-
129
-
130
-
131
-
132
-
133
-
134
-
135
-
136
-
137
-
138
-
139
-
140
-
141
-
142
-
143
-
144
-
145
-
146
-
147
-
148
-
149
-
150
-
151
-
152
-
153
-
154
-
155
-
156
-
157
-
158
-
159
-
160
-
161
-
162
-
163
-
164
-
165
-
166
-
167
-
168
-
169
-
170
-
171
-
172
-
173
-
174
-
175
-
176
-
177
-
178
-
179
-
180
-
181
-
182
-
183
-
 184
184 -
 185
185 -
 186
186 -
 187
187 -
 188
188 -
 189
189 -
 190
190 -
 191
191 -
 192
192 -
 193
193 -
 194
194 -
 195
195 -
 196
196 -
 197
197 -
 198
198 -
 199
199 -
 200
200 -
 201
201 -
 202
202 -
 203
203 -
 204
204 -
205
-
206
-
207
-
208
-
209
-
210
-
211
-
212
-
213
-
214
-
215
-
216
-
217
-
218
-
219
-
220
-
221
-
222
-
223
-
224
-
225
-
226
-
227
-
228
-
229
-
230
-
231
-
232
-
233
-
234
-
235
-
236
-
237
-
238
-
239
-
240
-
241
-
242
-
243
-
244
-
245
-
246
-
247
-
248
-
249
-
250
-
251
-
252
-
253
-
254
-
255
-
256
 |
 |

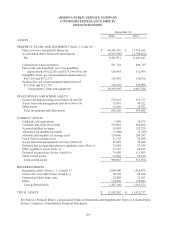
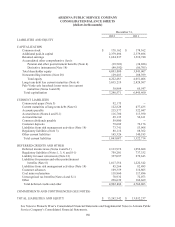
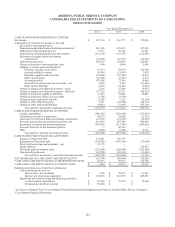
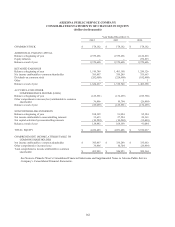
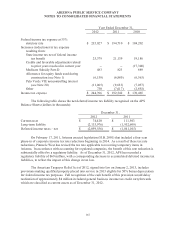
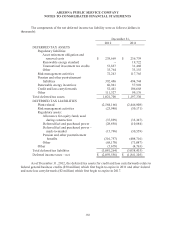
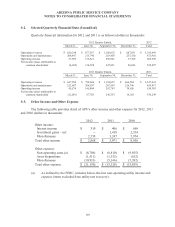
ARIZONA PUBLIC SERVICE COMPANY
NOTES TO CONSOLIDATED FINANCIAL STATEMENTS
169
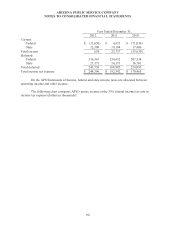
S-2. Selected Quarterly Financial Data (Unaudited)
Quarterly financial information for 2012 and 2011 is as follows (dollars in thousands):
2012 Quarter Ended,
2012
March 31,
June 30,
September 30,
December 31,
Total
Operating revenues
$ 620,248
$ 877,587
$ 1,108,623
$ 687,031
$ 3,293,489
Operations and maintenance
208,447
213,746
218,403
233,320
873,916
Operating income
53,995
176,821
296,945
77,768
605,529
Net income (loss) attributable to
common shareholder
(4,105)
124,928
247,831
26,843
395,497
2011 Quarter Ended,
2011
March 31,
June 30,
September 30,
December 31,
Total
Operating revenues
$ 647,994
$ 798,686
$ 1,124,057
$ 666,504
$ 3,237,241
Operations and maintenance
252,607
208,597
207,967
226,746
895,917
Operating income
45,574
145,400
292,783
70,626
554,383
Net income (loss) attributable to
common shareholder
(12,081)
87,705
246,333
14,292
336,249
S-3. Other Income and Other Expense
The following table provides detail of APS’s other income and other expense for 2012, 2011
and 2010 (dollars in thousands):
2012
2011
2010
Other income:
Interest income
$ 310
$ 406
$ 668
Investment gains – net
--
1,418
2,334
Miscellaneous
2,558
3,247
5,954
Total other income
$ 2,868
$ 5,071
$ 8,956
Other expense:
Non-operating costs (a)
$ (8,706)
$ (8,810)
$ (9,855)
Asset dispositions
(1,511)
(1,352)
(612)
Miscellaneous
(10,933)
(5,166)
(5,392)
Total other expense
$ (21,150)
$ (15,328)
$ (15,859)
(a) As defined by the FERC, includes below-the-line non-operating utility income and
expense (items excluded from utility rate recovery).