APS 2012 Annual Report Download - page 98
Download and view the complete annual report
Please find page 98 of the 2012 APS annual report below. You can navigate through the pages in the report by either clicking on the pages listed below, or by using the keyword search tool below to find specific information within the annual report.-
 1
1 -
2
-
3
-
4
-
5
-
6
-
7
-
8
-
9
-
10
-
11
-
12
-
13
-
14
-
15
-
16
-
17
-
18
-
19
-
20
-
21
-
22
-
23
-
24
-
25
-
26
-
27
-
28
-
29
-
30
-
31
-
32
-
33
-
34
-
35
-
36
-
37
-
38
-
39
-
40
-
41
-
42
-
43
-
44
-
45
-
46
-
47
-
48
-
49
-
50
-
51
-
52
-
53
-
54
-
55
-
56
-
57
-
58
-
59
-
60
-
61
-
62
-
63
-
64
-
65
-
66
-
67
-
68
-
69
-
70
-
71
-
72
-
73
-
74
-
75
-
76
-
77
-
78
-
79
-
80
-
81
-
82
-
83
-
84
-
85
-
86
-
87
-
 88
88 -
 89
89 -
 90
90 -
 91
91 -
 92
92 -
 93
93 -
 94
94 -
 95
95 -
 96
96 -
 97
97 -
 98
98 -
 99
99 -
 100
100 -
 101
101 -
 102
102 -
 103
103 -
 104
104 -
 105
105 -
 106
106 -
 107
107 -
 108
108 -
109
-
110
-
111
-
112
-
113
-
114
-
115
-
116
-
117
-
118
-
119
-
120
-
121
-
122
-
123
-
124
-
125
-
126
-
127
-
128
-
129
-
130
-
131
-
132
-
133
-
134
-
135
-
136
-
137
-
138
-
139
-
140
-
141
-
142
-
143
-
144
-
145
-
146
-
147
-
148
-
149
-
150
-
151
-
152
-
153
-
154
-
155
-
156
-
157
-
158
-
159
-
160
-
161
-
162
-
163
-
164
-
165
-
166
-
167
-
168
-
169
-
170
-
171
-
172
-
173
-
174
-
175
-
176
-
177
-
178
-
179
-
180
-
181
-
182
-
183
-
184
-
185
-
186
-
187
-
188
-
189
-
190
-
191
-
192
-
193
-
194
-
195
-
196
-
197
-
198
-
199
-
200
-
201
-
202
-
203
-
204
-
205
-
206
-
207
-
208
-
209
-
210
-
211
-
212
-
213
-
214
-
215
-
216
-
217
-
218
-
219
-
220
-
221
-
222
-
223
-
224
-
225
-
226
-
227
-
228
-
229
-
230
-
231
-
232
-
233
-
234
-
235
-
236
-
237
-
238
-
239
-
240
-
241
-
242
-
243
-
244
-
245
-
246
-
247
-
248
-
249
-
250
-
251
-
252
-
253
-
254
-
255
-
256
 |
 |

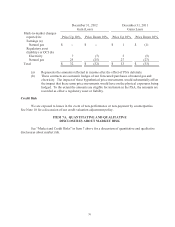
74
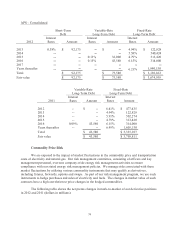
APS – Consolidated
Short-Term
Debt
Variable-Rate
Long-Term Debt
Fixed-Rate
Long-Term Debt
Interest
Interest
Interest
2012
Rates
Amount
Rates
Amount
Rates
Amount
2013
0.38%
$ 92,175
--
$ --
4.94%
$ 122,828
2014
--
--
--
--
5.58%
540,424
2015
--
--
0.13%
32,000
4.79%
313,420
2016
--
--
0.15%
43,580
6.15%
314,000
2017
--
--
--
--
--
--
Years thereafter
--
--
--
--
6.21%
1,840,150
Total
$ 92,175
$ 75,580
$ 3,130,822
Fair value
$ 92,175
$ 75,580
$ 3,674,958
Variable-Rate
Long-Term Debt
Fixed-Rate
Long-Term Debt
Interest
Interest
2011
Rates
Amount
Rates
Amount
2012
--
$ --
6.41%
$ 477,435
2013
--
--
4.94%
122,828
2014
--
--
5.91%
502,274
2015
--
--
4.79%
313,420
2016
0.09%
43,580
6.15%
314,000
Years thereafter
--
--
6.49%
1,605,150
Total
$ 43,580
$ 3,335,107
Fair value
$ 43,580
$ 3,758,811
Commodity Price Risk
We are exposed to the impact of market fluctuations in the commodity price and transportation
costs of electricity and natural gas. Our risk management committee, consisting of officers and key
management personnel, oversees company-wide energy risk management activities to ensure
compliance with our stated energy risk management policies. We manage risks associated with these
market fluctuations by utilizing various commodity instruments that may qualify as derivatives,
including futures, forwards, options and swaps. As part of our risk management program, we use such
instruments to hedge purchases and sales of electricity and fuels. The changes in market value of such
contracts have a high correlation to price changes in the hedged commodities.
The following table shows the net pretax changes in mark-to-market of our derivative positions
in 2012 and 2011 (dollars in millions):