APS 2012 Annual Report Download - page 174
Download and view the complete annual report
Please find page 174 of the 2012 APS annual report below. You can navigate through the pages in the report by either clicking on the pages listed below, or by using the keyword search tool below to find specific information within the annual report.-
 1
1 -
2
-
3
-
4
-
5
-
6
-
7
-
8
-
9
-
10
-
11
-
12
-
13
-
14
-
15
-
16
-
17
-
18
-
19
-
20
-
21
-
22
-
23
-
24
-
25
-
26
-
27
-
28
-
29
-
30
-
31
-
32
-
33
-
34
-
35
-
36
-
37
-
38
-
39
-
40
-
41
-
42
-
43
-
44
-
45
-
46
-
47
-
48
-
49
-
50
-
51
-
52
-
53
-
54
-
55
-
56
-
57
-
58
-
59
-
60
-
61
-
62
-
63
-
64
-
65
-
66
-
67
-
68
-
69
-
70
-
71
-
72
-
73
-
74
-
75
-
76
-
77
-
78
-
79
-
80
-
81
-
82
-
83
-
84
-
85
-
86
-
87
-
88
-
89
-
90
-
91
-
92
-
93
-
94
-
95
-
96
-
97
-
98
-
99
-
100
-
101
-
102
-
103
-
104
-
105
-
106
-
107
-
108
-
109
-
110
-
111
-
112
-
113
-
114
-
115
-
116
-
117
-
118
-
119
-
120
-
121
-
122
-
123
-
124
-
125
-
126
-
127
-
128
-
129
-
130
-
131
-
132
-
133
-
134
-
135
-
136
-
137
-
138
-
139
-
140
-
141
-
142
-
143
-
144
-
145
-
146
-
147
-
148
-
149
-
150
-
151
-
152
-
153
-
154
-
155
-
156
-
157
-
158
-
159
-
160
-
161
-
162
-
163
-
 164
164 -
 165
165 -
 166
166 -
 167
167 -
 168
168 -
 169
169 -
 170
170 -
 171
171 -
 172
172 -
 173
173 -
 174
174 -
 175
175 -
 176
176 -
 177
177 -
 178
178 -
 179
179 -
 180
180 -
 181
181 -
 182
182 -
 183
183 -
 184
184 -
185
-
186
-
187
-
188
-
189
-
190
-
191
-
192
-
193
-
194
-
195
-
196
-
197
-
198
-
199
-
200
-
201
-
202
-
203
-
204
-
205
-
206
-
207
-
208
-
209
-
210
-
211
-
212
-
213
-
214
-
215
-
216
-
217
-
218
-
219
-
220
-
221
-
222
-
223
-
224
-
225
-
226
-
227
-
228
-
229
-
230
-
231
-
232
-
233
-
234
-
235
-
236
-
237
-
238
-
239
-
240
-
241
-
242
-
243
-
244
-
245
-
246
-
247
-
248
-
249
-
250
-
251
-
252
-
253
-
254
-
255
-
256
 |
 |

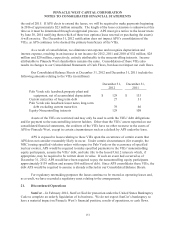
PINNACLE WEST CAPITAL CORPORATION
NOTES TO CONSOLIDATED FINANCIAL STATEMENTS
149
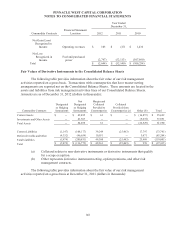
Commodity Contracts
Designated
as Hedging
Instruments
Not
Designated
as Hedging
Instruments
Margin and
Collateral
Provided to
Counterparties
Collateral
Provided from
Counterparties (a) Other (b) Total
Current Assets
$ 7,287
$ 76,162
$ 1,630
$ --
$ (54,815)
$ 30,264
Investments and Other Assets
3,804 58,273 -- -- (12,755) 49,322
Total Assets
11,091
134,435
1,630
--
(67,570)
79,586
Current Liabilities
(82,195)
(124,028)
107,228
(11,145)
56,172
(53,968)
Deferred Credits and Other
(68,137) (92,880) 65,768 -- 12,754 (82,495)
Total Liabilities
(150,332) (216,908) 172,996 (11,145) 68,926 (136,463)
Total Derivative Instruments
$ (139,241)
$ (82,473)
$ 174,626
$ (11,145)
$ 1,356
$ (56,877)
(a) Collateral relates to non-derivative instruments or derivative instruments that qualify
for a scope exception.
(b) Other represents derivative instrument netting, option premiums, and other risk
management contracts.
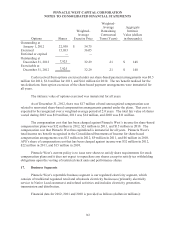
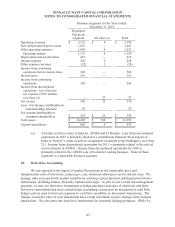
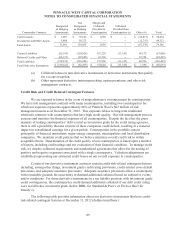
Credit Risk and Credit Related Contingent Features
We are exposed to losses in the event of nonperformance or nonpayment by counterparties.
We have risk management contracts with many counterparties, including two counterparties for
which our exposure represents approximately 86% of Pinnacle West’s $62 million of risk
management assets as of December 31, 2012. This exposure relates to long-term traditional
wholesale contracts with counterparties that have high credit quality. Our risk management process
assesses and monitors the financial exposure of all counterparties. Despite the fact that the great
majority of trading counterparties’ debt is rated as investment grade by the credit rating agencies,
there is still a possibility that one or more of these companies could default, resulting in a material
impact on consolidated earnings for a given period. Counterparties in the portfolio consist
principally of financial institutions, major energy companies, municipalities and local distribution
companies. We maintain credit policies that we believe minimize overall credit risk to within
acceptable limits. Determination of the credit quality of our counterparties is based upon a number
of factors, including credit ratings and our evaluation of their financial condition. To manage credit
risk, we employ collateral requirements and standardized agreements that allow for the netting of
positive and negative exposures associated with a single counterparty. Valuation adjustments are
established representing our estimated credit losses on our overall exposure to counterparties.
Certain of our derivative instrument contracts contain credit-risk-related contingent features
including, among other things, investment grade credit rating provisions, credit-related cross default
provisions, and adequate assurance provisions. Adequate assurance provisions allow a counterparty
with reasonable grounds for uncertainty to demand additional collateral based on subjective events
and/or conditions. For those derivative instruments in a net liability position, with investment grade
credit contingencies, the counterparties could demand additional collateral if our debt credit rating
were to fall below investment grade (below BBB- for Standard & Poor’s or Fitch or Baa3 for
Moody’s).
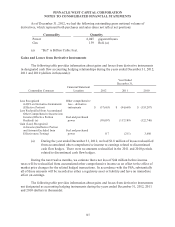
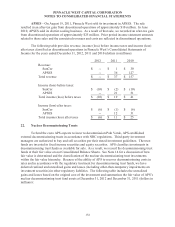
The following table provides information about our derivative instruments that have credit-
risk-related contingent features at December 31, 2012 (dollars in millions):