APS 2012 Annual Report Download - page 109
Download and view the complete annual report
Please find page 109 of the 2012 APS annual report below. You can navigate through the pages in the report by either clicking on the pages listed below, or by using the keyword search tool below to find specific information within the annual report.-
 1
1 -
2
-
3
-
4
-
5
-
6
-
7
-
8
-
9
-
10
-
11
-
12
-
13
-
14
-
15
-
16
-
17
-
18
-
19
-
20
-
21
-
22
-
23
-
24
-
25
-
26
-
27
-
28
-
29
-
30
-
31
-
32
-
33
-
34
-
35
-
36
-
37
-
38
-
39
-
40
-
41
-
42
-
43
-
44
-
45
-
46
-
47
-
48
-
49
-
50
-
51
-
52
-
53
-
54
-
55
-
56
-
57
-
58
-
59
-
60
-
61
-
62
-
63
-
64
-
65
-
66
-
67
-
68
-
69
-
70
-
71
-
72
-
73
-
74
-
75
-
76
-
77
-
78
-
79
-
80
-
81
-
82
-
83
-
84
-
85
-
86
-
87
-
88
-
89
-
90
-
91
-
92
-
93
-
94
-
95
-
96
-
97
-
98
-
 99
99 -
 100
100 -
 101
101 -
 102
102 -
 103
103 -
 104
104 -
 105
105 -
 106
106 -
 107
107 -
 108
108 -
 109
109 -
 110
110 -
 111
111 -
 112
112 -
 113
113 -
 114
114 -
 115
115 -
 116
116 -
 117
117 -
 118
118 -
 119
119 -
120
-
121
-
122
-
123
-
124
-
125
-
126
-
127
-
128
-
129
-
130
-
131
-
132
-
133
-
134
-
135
-
136
-
137
-
138
-
139
-
140
-
141
-
142
-
143
-
144
-
145
-
146
-
147
-
148
-
149
-
150
-
151
-
152
-
153
-
154
-
155
-
156
-
157
-
158
-
159
-
160
-
161
-
162
-
163
-
164
-
165
-
166
-
167
-
168
-
169
-
170
-
171
-
172
-
173
-
174
-
175
-
176
-
177
-
178
-
179
-
180
-
181
-
182
-
183
-
184
-
185
-
186
-
187
-
188
-
189
-
190
-
191
-
192
-
193
-
194
-
195
-
196
-
197
-
198
-
199
-
200
-
201
-
202
-
203
-
204
-
205
-
206
-
207
-
208
-
209
-
210
-
211
-
212
-
213
-
214
-
215
-
216
-
217
-
218
-
219
-
220
-
221
-
222
-
223
-
224
-
225
-
226
-
227
-
228
-
229
-
230
-
231
-
232
-
233
-
234
-
235
-
236
-
237
-
238
-
239
-
240
-
241
-
242
-
243
-
244
-
245
-
246
-
247
-
248
-
249
-
250
-
251
-
252
-
253
-
254
-
255
-
256
 |
 |

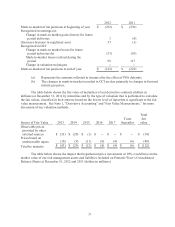
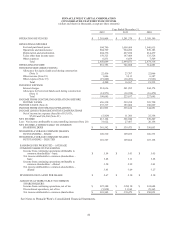
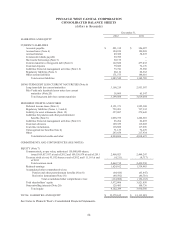
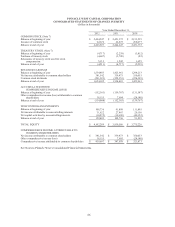
84
PINNACLE WEST CAPITAL CORPORATION
CONSOLIDATED BALANCE SHEETS
(dollars in thousands)
December 31,
2012
2011
LIABILITIES AND EQUITY
CURRENT LIABILITIES
Accounts payable
$ 221,312
$ 326,987
Accrued taxes (Note 4)
124,939
120,289
Accrued interest
49,380
54,872
Common dividends payable
59,789
--
Short-term borrowings (Note 5)
92,175
--
Current maturities of long-term debt (Note 6)
122,828
477,435
Customer deposits
79,689
72,176
Liabilities from risk management activities (Note 18)
73,741
53,968
Regulatory liabilities (Note 3)
88,116
88,362
Other current liabilities
171,573
148,616
Total current liabilities
1,083,542
1,342,705
LONG-TERM DEBT LESS CURRENT MATURITIES (Note 6)
Long-term debt less current maturities
3,160,219
2,953,507
Palo Verde sale leaseback lessor notes less current
maturities (Note 20)
38,869
65,547
Total long-term debt less current maturities
3,199,088
3,019,054
DEFERRED CREDITS AND OTHER
Deferred income taxes (Note 4)
2,151,371
1,925,388
Regulatory liabilities (Notes 1, 3 and 4)
759,201
737,332
Liability for asset retirements (Note 12)
357,097
279,643
Liabilities for pension and other postretirement
benefits (Note 8)
1,058,755
1,268,910
Liabilities from risk management activities (Note 18)
85,264
82,495
Customer advances
109,359
116,805
Coal mine reclamation
118,860
117,896
Unrecognized tax benefits (Note 4)
71,135
72,270
Other
283,654
217,934
Total deferred credits and other
4,994,696
4,818,673
COMMITMENTS AND CONTINGENCIES (SEE NOTES)
EQUITY (Note 7)
Common stock, no par value; authorized 150,000,000 shares,
issued 109,837,957 at end of 2012 and 109,356,974 at end of 2011
2,466,923
2,444,247
Treasury stock at cost; 95,192 shares at end of 2012 and 111,161 at end
of 2011
(4,211)
(4,717)
Total common stock
2,462,712
2,439,530
Retained earnings
1,624,102
1,534,483
Accumulated other comprehensive loss:
Pension and other postretirement benefits (Note 8)
(64,416)
(65,447)
Derivative instruments (Note 18)
(49,592)
(86,716)
Total accumulated other comprehensive loss
(114,008)
(152,163)
Total shareholders’ equity
3,972,806
3,821,850
Noncontrolling interests (Note 20)
129,483
108,736
Total equity
4,102,289
3,930,586
TOTAL LIABILITIES AND EQUITY
$ 13,379,615
$ 13,111,018
See Notes to Pinnacle West’s Consolidated Financial Statements.