APS 2012 Annual Report Download - page 173
Download and view the complete annual report
Please find page 173 of the 2012 APS annual report below. You can navigate through the pages in the report by either clicking on the pages listed below, or by using the keyword search tool below to find specific information within the annual report.-
 1
1 -
2
-
3
-
4
-
5
-
6
-
7
-
8
-
9
-
10
-
11
-
12
-
13
-
14
-
15
-
16
-
17
-
18
-
19
-
20
-
21
-
22
-
23
-
24
-
25
-
26
-
27
-
28
-
29
-
30
-
31
-
32
-
33
-
34
-
35
-
36
-
37
-
38
-
39
-
40
-
41
-
42
-
43
-
44
-
45
-
46
-
47
-
48
-
49
-
50
-
51
-
52
-
53
-
54
-
55
-
56
-
57
-
58
-
59
-
60
-
61
-
62
-
63
-
64
-
65
-
66
-
67
-
68
-
69
-
70
-
71
-
72
-
73
-
74
-
75
-
76
-
77
-
78
-
79
-
80
-
81
-
82
-
83
-
84
-
85
-
86
-
87
-
88
-
89
-
90
-
91
-
92
-
93
-
94
-
95
-
96
-
97
-
98
-
99
-
100
-
101
-
102
-
103
-
104
-
105
-
106
-
107
-
108
-
109
-
110
-
111
-
112
-
113
-
114
-
115
-
116
-
117
-
118
-
119
-
120
-
121
-
122
-
123
-
124
-
125
-
126
-
127
-
128
-
129
-
130
-
131
-
132
-
133
-
134
-
135
-
136
-
137
-
138
-
139
-
140
-
141
-
142
-
143
-
144
-
145
-
146
-
147
-
148
-
149
-
150
-
151
-
152
-
153
-
154
-
155
-
156
-
157
-
158
-
159
-
160
-
161
-
162
-
 163
163 -
 164
164 -
 165
165 -
 166
166 -
 167
167 -
 168
168 -
 169
169 -
 170
170 -
 171
171 -
 172
172 -
 173
173 -
 174
174 -
 175
175 -
 176
176 -
 177
177 -
 178
178 -
 179
179 -
 180
180 -
 181
181 -
 182
182 -
 183
183 -
184
-
185
-
186
-
187
-
188
-
189
-
190
-
191
-
192
-
193
-
194
-
195
-
196
-
197
-
198
-
199
-
200
-
201
-
202
-
203
-
204
-
205
-
206
-
207
-
208
-
209
-
210
-
211
-
212
-
213
-
214
-
215
-
216
-
217
-
218
-
219
-
220
-
221
-
222
-
223
-
224
-
225
-
226
-
227
-
228
-
229
-
230
-
231
-
232
-
233
-
234
-
235
-
236
-
237
-
238
-
239
-
240
-
241
-
242
-
243
-
244
-
245
-
246
-
247
-
248
-
249
-
250
-
251
-
252
-
253
-
254
-
255
-
256
 |
 |

PINNACLE WEST CAPITAL CORPORATION
NOTES TO CONSOLIDATED FINANCIAL STATEMENTS
148
Year Ended
December 31,
Commodity Contracts
Financial Statement
Location 2012 2011 2010
Net Gain (Loss)
Recognized in
Income
Operating revenues
$ 103
$ (27)
$ 1,436
Net Loss
Recognized in
Income
Fuel and purchased
power
(2,747) (52,113) (107,690)
Total
$ (2,644)
$ (52,140)
$ (106,254)
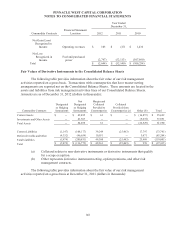
Fair Values of Derivative Instruments in the Consolidated Balance Sheets
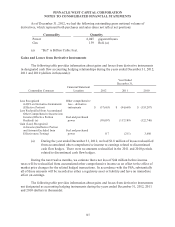
The following table provides information about the fair value of our risk management
activities reported on a gross basis. Transactions with counterparties that have master netting
arrangements are reported net on the Consolidated Balance Sheets. These amounts are located in the
assets and liabilities from risk management activities lines of our Consolidated Balance Sheets.
Amounts are as of December 31, 2012 (dollars in thousands):
Commodity Contracts
Designated
as Hedging
Instruments
Not
Designated
as Hedging
Instruments
Margin and
Collateral
Provided to
Counterparties
Collateral
Provided from
Counterparties (a) Other (b) Total
Current Assets
$ --
$ 42,495
$ 61
$ --
$ (16,857)
$ 25,699
Investments and Other Assets
-- 41,563 -- -- (5,672) 35,891
Total Assets
-- 84,058 61 -- (22,529) 61,590
Current Liabilities
(1,147)
(104,177)
39,249
(25,463)
17,797
(73,741)
Deferred Credits and Other
(4,332) (96,654) 10,051 -- 5,671 (85,264)
Total Liabilities
(5,479) (200,831) 49,300 (25,463) 23,468 (159,005)
Total
$ (5,479)
$ (116,773)
$ 49,361
$ (25,463)
$ 939
$ (97,415)
(a) Collateral relates to non-derivative instruments or derivative instruments that qualify
for a scope exception.
(b) Other represents derivative instrument netting, option premiums, and other risk
management contracts.
The following table provides information about the fair value of our risk management
activities reported on a gross basis at December 31, 2011 (dollars in thousands):