APS 2012 Annual Report Download - page 117
Download and view the complete annual report
Please find page 117 of the 2012 APS annual report below. You can navigate through the pages in the report by either clicking on the pages listed below, or by using the keyword search tool below to find specific information within the annual report.-
 1
1 -
2
-
3
-
4
-
5
-
6
-
7
-
8
-
9
-
10
-
11
-
12
-
13
-
14
-
15
-
16
-
17
-
18
-
19
-
20
-
21
-
22
-
23
-
24
-
25
-
26
-
27
-
28
-
29
-
30
-
31
-
32
-
33
-
34
-
35
-
36
-
37
-
38
-
39
-
40
-
41
-
42
-
43
-
44
-
45
-
46
-
47
-
48
-
49
-
50
-
51
-
52
-
53
-
54
-
55
-
56
-
57
-
58
-
59
-
60
-
61
-
62
-
63
-
64
-
65
-
66
-
67
-
68
-
69
-
70
-
71
-
72
-
73
-
74
-
75
-
76
-
77
-
78
-
79
-
80
-
81
-
82
-
83
-
84
-
85
-
86
-
87
-
88
-
89
-
90
-
91
-
92
-
93
-
94
-
95
-
96
-
97
-
98
-
99
-
100
-
101
-
102
-
103
-
104
-
105
-
106
-
 107
107 -
 108
108 -
 109
109 -
 110
110 -
 111
111 -
 112
112 -
 113
113 -
 114
114 -
 115
115 -
 116
116 -
 117
117 -
 118
118 -
 119
119 -
 120
120 -
 121
121 -
 122
122 -
 123
123 -
 124
124 -
 125
125 -
 126
126 -
 127
127 -
128
-
129
-
130
-
131
-
132
-
133
-
134
-
135
-
136
-
137
-
138
-
139
-
140
-
141
-
142
-
143
-
144
-
145
-
146
-
147
-
148
-
149
-
150
-
151
-
152
-
153
-
154
-
155
-
156
-
157
-
158
-
159
-
160
-
161
-
162
-
163
-
164
-
165
-
166
-
167
-
168
-
169
-
170
-
171
-
172
-
173
-
174
-
175
-
176
-
177
-
178
-
179
-
180
-
181
-
182
-
183
-
184
-
185
-
186
-
187
-
188
-
189
-
190
-
191
-
192
-
193
-
194
-
195
-
196
-
197
-
198
-
199
-
200
-
201
-
202
-
203
-
204
-
205
-
206
-
207
-
208
-
209
-
210
-
211
-
212
-
213
-
214
-
215
-
216
-
217
-
218
-
219
-
220
-
221
-
222
-
223
-
224
-
225
-
226
-
227
-
228
-
229
-
230
-
231
-
232
-
233
-
234
-
235
-
236
-
237
-
238
-
239
-
240
-
241
-
242
-
243
-
244
-
245
-
246
-
247
-
248
-
249
-
250
-
251
-
252
-
253
-
254
-
255
-
256
 |
 |

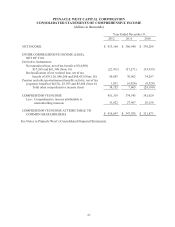
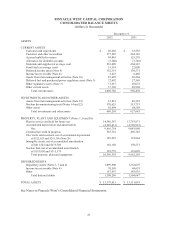
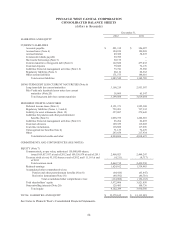
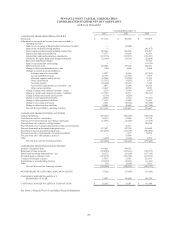
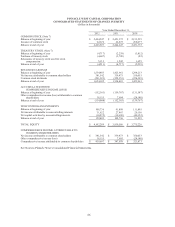
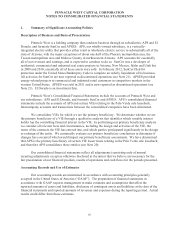
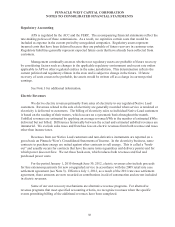
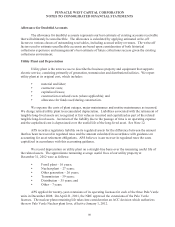
PINNACLE WEST CAPITAL CORPORATION
NOTES TO CONSOLIDATED FINANCIAL STATEMENTS
92
thermal units produced within the current period. This calculation determines the current period nuclear
fuel expense.
APS also charges nuclear fuel expense for the interim storage and permanent disposal of spent
nuclear fuel. The DOE is responsible for the permanent disposal of spent nuclear fuel and charges APS
$0.001 per kWh of nuclear generation. See Note 11 for information on spent nuclear fuel disposal
costs.
Income Taxes
Income taxes are provided using the asset and liability approach prescribed by guidance relating
to accounting for income taxes. We file our federal income tax return on a consolidated basis and we
file our state income tax returns on a consolidated or unitary basis. In accordance with our
intercompany tax sharing agreement, federal and state income taxes are allocated to each first-tier
subsidiary as though each first-tier subsidiary filed a separate income tax return. Any difference
between that method and the consolidated (and unitary) income tax liability is attributed to the parent
company. The income tax accounts reflect the tax and interest associated with management’s estimate
of the largest amount of tax benefit that is greater than 50% likely of being realized upon settlement for
all known and measurable tax exposures (see Note 4).
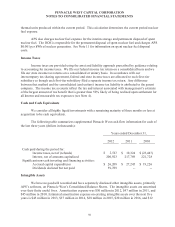
Cash and Cash Equivalents
We consider all highly liquid investments with a remaining maturity of three months or less at
acquisition to be cash equivalents.
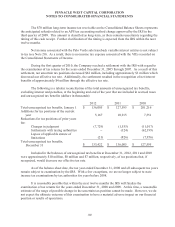
The following table summarizes supplemental Pinnacle West cash flow information for each of
the last three years (dollars in thousands):
Years ended December 31,
2012
2011
2010
Cash paid during the period for:
Income taxes, net of (refunds)
$ 2,543
$ 10,324
$ (23,447)
Interest, net of amounts capitalized
200,923
217,789
221,728
Significant non-cash investing and financing activities:
Accrued capital expenditures
$ 26,208
$ 27,245
$ 19,226
Dividends declared but not paid
59,789
--
--
Intangible Assets
We have no goodwill recorded and have separately disclosed other intangible assets, primarily
APS’s software, on Pinnacle West’s Consolidated Balance Sheets. The intangible assets are amortized
over their finite useful lives. Amortization expense was $50 million in 2012, $47 million in 2011, and
$45 million in 2010. Estimated amortization expense on existing intangible assets over the next five
years is $45 million in 2013, $37 million in 2014, $28 million in 2015, $20 million in 2016, and $12