APS 2012 Annual Report Download - page 86
Download and view the complete annual report
Please find page 86 of the 2012 APS annual report below. You can navigate through the pages in the report by either clicking on the pages listed below, or by using the keyword search tool below to find specific information within the annual report.-
 1
1 -
2
-
3
-
4
-
5
-
6
-
7
-
8
-
9
-
10
-
11
-
12
-
13
-
14
-
15
-
16
-
17
-
18
-
19
-
20
-
21
-
22
-
23
-
24
-
25
-
26
-
27
-
28
-
29
-
30
-
31
-
32
-
33
-
34
-
35
-
36
-
37
-
38
-
39
-
40
-
41
-
42
-
43
-
44
-
45
-
46
-
47
-
48
-
49
-
50
-
51
-
52
-
53
-
54
-
55
-
56
-
57
-
58
-
59
-
60
-
61
-
62
-
63
-
64
-
65
-
66
-
67
-
68
-
69
-
70
-
71
-
72
-
73
-
74
-
75
-
 76
76 -
 77
77 -
 78
78 -
 79
79 -
 80
80 -
 81
81 -
 82
82 -
 83
83 -
 84
84 -
 85
85 -
 86
86 -
 87
87 -
 88
88 -
 89
89 -
 90
90 -
 91
91 -
 92
92 -
 93
93 -
 94
94 -
 95
95 -
 96
96 -
97
-
98
-
99
-
100
-
101
-
102
-
103
-
104
-
105
-
106
-
107
-
108
-
109
-
110
-
111
-
112
-
113
-
114
-
115
-
116
-
117
-
118
-
119
-
120
-
121
-
122
-
123
-
124
-
125
-
126
-
127
-
128
-
129
-
130
-
131
-
132
-
133
-
134
-
135
-
136
-
137
-
138
-
139
-
140
-
141
-
142
-
143
-
144
-
145
-
146
-
147
-
148
-
149
-
150
-
151
-
152
-
153
-
154
-
155
-
156
-
157
-
158
-
159
-
160
-
161
-
162
-
163
-
164
-
165
-
166
-
167
-
168
-
169
-
170
-
171
-
172
-
173
-
174
-
175
-
176
-
177
-
178
-
179
-
180
-
181
-
182
-
183
-
184
-
185
-
186
-
187
-
188
-
189
-
190
-
191
-
192
-
193
-
194
-
195
-
196
-
197
-
198
-
199
-
200
-
201
-
202
-
203
-
204
-
205
-
206
-
207
-
208
-
209
-
210
-
211
-
212
-
213
-
214
-
215
-
216
-
217
-
218
-
219
-
220
-
221
-
222
-
223
-
224
-
225
-
226
-
227
-
228
-
229
-
230
-
231
-
232
-
233
-
234
-
235
-
236
-
237
-
238
-
239
-
240
-
241
-
242
-
243
-
244
-
245
-
246
-
247
-
248
-
249
-
250
-
251
-
252
-
253
-
254
-
255
-
256
 |
 |
62
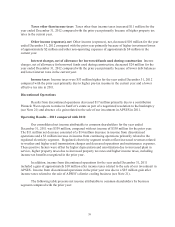
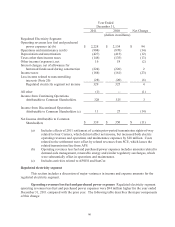
Discontinued Operations
Income from discontinued operations for year ended December 31, 2011 included a gain of $10
million related to the sale of our investment in APSES. Income from discontinued operations for the
year ended December 31, 2010 included an after tax gain of $25 million related to the sale of APSES’s
district cooling business (see Note 21).
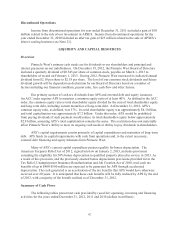
LIQUIDITY AND CAPITAL RESOURCES
Overview
Pinnacle West’s primary cash needs are for dividends to our shareholders and principal and
interest payments on our indebtedness. On December 19, 2012, the Pinnacle West Board of Directors
declared a quarterly dividend of $0.545 per share of common stock, payable on March 1, 2013 to
shareholders of record on February 1, 2013. During 2012, Pinnacle West increased its indicated annual
dividend from $2.10 per share to $2.18 per share. The level of our common stock dividends and future
dividend growth will be dependent on declaration by our Board of Directors based on a number of
factors including our financial condition, payout ratio, free cash flow and other factors.
Our primary sources of cash are dividends from APS and external debt and equity issuances.
An ACC order requires APS to maintain a common equity ratio of at least 40%. As defined in the ACC
order, the common equity ratio is total shareholder equity divided by the sum of total shareholder equity
and long-term debt, including current maturities of long-term debt. At December 31, 2012, APS’s
common equity ratio, as defined, was 57%. Its total shareholder equity was approximately $4.1 billion,
and total capitalization was approximately $7.2 billion. Under this order, APS would be prohibited
from paying dividends if such payment would reduce its total shareholder equity below approximately
$2.9 billion, assuming APS’s total capitalization remains the same. This restriction does not materially
affect Pinnacle West’s ability to meet its ongoing cash needs or ability to pay dividends to shareholders.
APS’s capital requirements consist primarily of capital expenditures and maturities of long-term
debt. APS funds its capital requirements with cash from operations and, to the extent necessary,
external debt financing and equity infusions from Pinnacle West.
Many of APS’s current capital expenditure projects qualify for bonus depreciation. The
American Taxpayer Relief Act of 2012, signed into law on January 2, 2013, includes provisions
extending the eligibility for 50% bonus depreciation to qualified property placed in service in 2013. As
a result of this provision, and the previously enacted bonus depreciation provisions provided for in the
Tax Relief, Unemployment Insurance Reauthorization and Job Creation Act of 2010, total cash tax
benefits of up to $400-$500 million are expected to be generated for APS through accelerated
depreciation. The cash generated is an acceleration of the tax benefits that APS would have otherwise
received over 20 years. It is anticipated that these cash benefits will be fully realized by APS by the end
of 2013, with a majority of the benefit realized as of December 31, 2012.
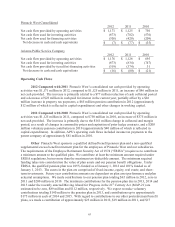
Summary of Cash Flows
The following tables present net cash provided by (used for) operating, investing and financing
activities for the years ended December 31, 2012, 2011 and 2010 (dollars in millions):