APS 2012 Annual Report Download - page 178
Download and view the complete annual report
Please find page 178 of the 2012 APS annual report below. You can navigate through the pages in the report by either clicking on the pages listed below, or by using the keyword search tool below to find specific information within the annual report.-
 1
1 -
2
-
3
-
4
-
5
-
6
-
7
-
8
-
9
-
10
-
11
-
12
-
13
-
14
-
15
-
16
-
17
-
18
-
19
-
20
-
21
-
22
-
23
-
24
-
25
-
26
-
27
-
28
-
29
-
30
-
31
-
32
-
33
-
34
-
35
-
36
-
37
-
38
-
39
-
40
-
41
-
42
-
43
-
44
-
45
-
46
-
47
-
48
-
49
-
50
-
51
-
52
-
53
-
54
-
55
-
56
-
57
-
58
-
59
-
60
-
61
-
62
-
63
-
64
-
65
-
66
-
67
-
68
-
69
-
70
-
71
-
72
-
73
-
74
-
75
-
76
-
77
-
78
-
79
-
80
-
81
-
82
-
83
-
84
-
85
-
86
-
87
-
88
-
89
-
90
-
91
-
92
-
93
-
94
-
95
-
96
-
97
-
98
-
99
-
100
-
101
-
102
-
103
-
104
-
105
-
106
-
107
-
108
-
109
-
110
-
111
-
112
-
113
-
114
-
115
-
116
-
117
-
118
-
119
-
120
-
121
-
122
-
123
-
124
-
125
-
126
-
127
-
128
-
129
-
130
-
131
-
132
-
133
-
134
-
135
-
136
-
137
-
138
-
139
-
140
-
141
-
142
-
143
-
144
-
145
-
146
-
147
-
148
-
149
-
150
-
151
-
152
-
153
-
154
-
155
-
156
-
157
-
158
-
159
-
160
-
161
-
162
-
163
-
164
-
165
-
166
-
167
-
 168
168 -
 169
169 -
 170
170 -
 171
171 -
 172
172 -
 173
173 -
 174
174 -
 175
175 -
 176
176 -
 177
177 -
 178
178 -
 179
179 -
 180
180 -
 181
181 -
 182
182 -
 183
183 -
 184
184 -
 185
185 -
 186
186 -
 187
187 -
 188
188 -
189
-
190
-
191
-
192
-
193
-
194
-
195
-
196
-
197
-
198
-
199
-
200
-
201
-
202
-
203
-
204
-
205
-
206
-
207
-
208
-
209
-
210
-
211
-
212
-
213
-
214
-
215
-
216
-
217
-
218
-
219
-
220
-
221
-
222
-
223
-
224
-
225
-
226
-
227
-
228
-
229
-
230
-
231
-
232
-
233
-
234
-
235
-
236
-
237
-
238
-
239
-
240
-
241
-
242
-
243
-
244
-
245
-
246
-
247
-
248
-
249
-
250
-
251
-
252
-
253
-
254
-
255
-
256
 |
 |

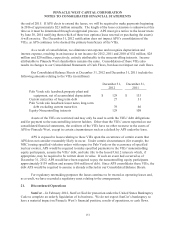
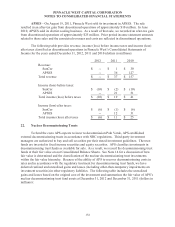
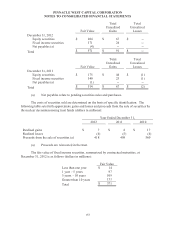
PINNACLE WEST CAPITAL CORPORATION
NOTES TO CONSOLIDATED FINANCIAL STATEMENTS
153
Fair Value
Total
Unrealized
Gains
Total
Unrealized
Losses
December 31, 2012
Equity securities
$ 204
$ 67
$ --
Fixed income securities
371
24
--
Net payables (a)
(4)
--
--
Total
$ 571
$ 91
$ --
Fair Value
Total
Unrealized
Gains
Total
Unrealized
Losses
December 31, 2011
Equity securities
$ 175
$ 44
$ (1)
Fixed income securities
340
23
(1)
Net payables (a)
(1)
--
--
Total
$ 514
$ 67
$ (2)
(a) Net payables relate to pending securities sales and purchases.
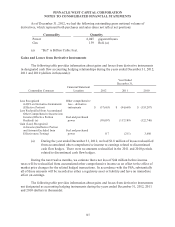
The costs of securities sold are determined on the basis of specific identification. The
following table sets forth approximate gains and losses and proceeds from the sale of securities by
the nuclear decommissioning trust funds (dollars in millions):
Year Ended December 31,
2012
2011
2010
Realized gains
$ 7
$ 8
$ 17
Realized losses
(4)
(5)
(4)
Proceeds from the sale of securities (a)
418
498
560
(a) Proceeds are reinvested in the trust.
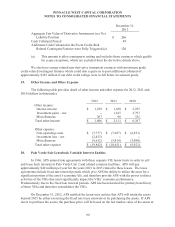
The fair value of fixed income securities, summarized by contractual maturities, at
December 31, 2012 is as follows (dollars in millions):
Fair Value
Less than one year
$ 14
1 year – 5 years
97
5 years – 10 years
109
Greater than 10 years
151
Total
$ 371