APS 2012 Annual Report Download - page 110
Download and view the complete annual report
Please find page 110 of the 2012 APS annual report below. You can navigate through the pages in the report by either clicking on the pages listed below, or by using the keyword search tool below to find specific information within the annual report.-
 1
1 -
2
-
3
-
4
-
5
-
6
-
7
-
8
-
9
-
10
-
11
-
12
-
13
-
14
-
15
-
16
-
17
-
18
-
19
-
20
-
21
-
22
-
23
-
24
-
25
-
26
-
27
-
28
-
29
-
30
-
31
-
32
-
33
-
34
-
35
-
36
-
37
-
38
-
39
-
40
-
41
-
42
-
43
-
44
-
45
-
46
-
47
-
48
-
49
-
50
-
51
-
52
-
53
-
54
-
55
-
56
-
57
-
58
-
59
-
60
-
61
-
62
-
63
-
64
-
65
-
66
-
67
-
68
-
69
-
70
-
71
-
72
-
73
-
74
-
75
-
76
-
77
-
78
-
79
-
80
-
81
-
82
-
83
-
84
-
85
-
86
-
87
-
88
-
89
-
90
-
91
-
92
-
93
-
94
-
95
-
96
-
97
-
98
-
99
-
 100
100 -
 101
101 -
 102
102 -
 103
103 -
 104
104 -
 105
105 -
 106
106 -
 107
107 -
 108
108 -
 109
109 -
 110
110 -
 111
111 -
 112
112 -
 113
113 -
 114
114 -
 115
115 -
 116
116 -
 117
117 -
 118
118 -
 119
119 -
 120
120 -
121
-
122
-
123
-
124
-
125
-
126
-
127
-
128
-
129
-
130
-
131
-
132
-
133
-
134
-
135
-
136
-
137
-
138
-
139
-
140
-
141
-
142
-
143
-
144
-
145
-
146
-
147
-
148
-
149
-
150
-
151
-
152
-
153
-
154
-
155
-
156
-
157
-
158
-
159
-
160
-
161
-
162
-
163
-
164
-
165
-
166
-
167
-
168
-
169
-
170
-
171
-
172
-
173
-
174
-
175
-
176
-
177
-
178
-
179
-
180
-
181
-
182
-
183
-
184
-
185
-
186
-
187
-
188
-
189
-
190
-
191
-
192
-
193
-
194
-
195
-
196
-
197
-
198
-
199
-
200
-
201
-
202
-
203
-
204
-
205
-
206
-
207
-
208
-
209
-
210
-
211
-
212
-
213
-
214
-
215
-
216
-
217
-
218
-
219
-
220
-
221
-
222
-
223
-
224
-
225
-
226
-
227
-
228
-
229
-
230
-
231
-
232
-
233
-
234
-
235
-
236
-
237
-
238
-
239
-
240
-
241
-
242
-
243
-
244
-
245
-
246
-
247
-
248
-
249
-
250
-
251
-
252
-
253
-
254
-
255
-
256
 |
 |

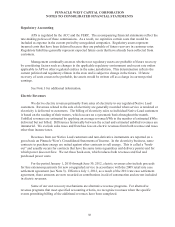
85
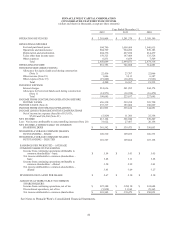
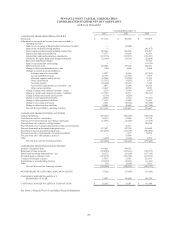
PINNACLE WEST CAPITAL CORPORATION
CONSOLIDATED STATEMENTS OF CASH FLOWS
(dollars in thousands)
Year Ended December 31,
2012
2011
2010
CASH FLOWS FROM OPERATING ACTIVITIES
Net Income
$ 413,164
$ 366,940
$ 370,209
Adjustments to reconcile net income to net cash provided by
operating activities:
Gain on sale of energy-related products and services business
--
(10,404)
--
Gain on sale of district cooling business
--
--
(41,973)
Depreciation and amortization including nuclear fuel
481,262
493,784
472,807
Deferred fuel and purchased power
71,573
69,166
93,631
Deferred fuel and purchased power amortization
(116,716)
(155,157)
(122,481)
Allowance for equity funds used during construction
(22,436)
(23,707)
(22,066)
Real estate impairment charges
--
--
16,731
Gain on real estate debt restructuring
--
--
(16,755)
Deferred income taxes
228,602
176,192
260,411
Change in derivative instruments fair value
(749)
4,064
2,688
Changes in current assets and liabilities:
Customer and other receivables
14,587
40,626
(67,943)
Accrued unbilled revenues
30,394
(21,947)
7,679
Materials, supplies and fossil fuel
(23,043)
(23,398)
12,276
Other current assets
(27,352)
(3,079)
9,375
Accounts payable
(96,600)
58,346
9,125
Accrued taxes and income tax receivable – net
8,693
12,068
24,222
Other current liabilities
23,869
20,358
2,921
Change in margin and collateral accounts – assets
2,216
33,349
(9,937)
Change in margin and collateral accounts – liabilities
137,785
29,731
(88,315)
Change in long term income tax receivable
(1,756)
(3,530)
--
Change in unrecognized tax benefits
(2,583)
8,410
(73,621)
Change in other regulatory liabilities
13,539
37,009
56,801
Change in other long-term assets
6,872
(41,722)
(47,940)
Change in other long-term liabilities
29,801
58,484
(97,388)
Net cash flow provided by operating activities
1,171,122
1,125,583
750,457
CASH FLOWS FROM INVESTING ACTIVITIES
Capital expenditures
(889,551)
(884,350)
(748,374)
Contributions in aid of construction
49,876
38,096
32,754
Allowance for borrowed funds used during construction
(14,971)
(18,358)
(16,778)
Proceeds from sale of district cooling business
--
--
100,300
Proceeds from sale of energy-related products and services business
--
45,111
--
Proceeds from nuclear decommissioning trust sales
417,603
497,780
560,469
Investment in nuclear decommissioning trust
(434,852)
(513,799)
(584,885)
Proceeds from sale of commercial real estate investments
--
1,375
72,038
Proceeds from sale of life insurance policies
--
55,444
--
Other
(1,099)
(3,306)
8,576
Net cash flow used for investing activities
(872,994)
(782,007)
(575,900)
CASH FLOWS FROM FINANCING ACTIVITIES
Issuance of long-term debt
476,081
470,353
--
Repayment of long-term debt
(654,286)
(655,169)
(106,572)
Short-term borrowings and payments – net
92,175
(16,600)
(137,115)
Dividends paid on common stock
(225,075)
(221,728)
(216,979)
Common stock equity issuance
15,955
15,841
255,971
Distributions to noncontrolling interests
(10,529)
(10,210)
(11,403)
Other
170
(2,668)
6,351
Net cash flow used for financing activities
(305,509)
(420,181)
(209,747)
NET DECREASE IN CASH AND CASH EQUIVALENTS
(7,381)
(76,605)
(35,190)
CASH AND CASH EQUIVALENTS AT
BEGINNING OF YEAR
33,583 110,188 145,378
CASH AND CASH EQUIVALENTS AT END OF YEAR
$ 26,202
$ 33,583
$ 110,188
See Notes to Pinnacle West’s Consolidated Financial Statements.