APS 2012 Annual Report Download - page 142
Download and view the complete annual report
Please find page 142 of the 2012 APS annual report below. You can navigate through the pages in the report by either clicking on the pages listed below, or by using the keyword search tool below to find specific information within the annual report.-
 1
1 -
2
-
3
-
4
-
5
-
6
-
7
-
8
-
9
-
10
-
11
-
12
-
13
-
14
-
15
-
16
-
17
-
18
-
19
-
20
-
21
-
22
-
23
-
24
-
25
-
26
-
27
-
28
-
29
-
30
-
31
-
32
-
33
-
34
-
35
-
36
-
37
-
38
-
39
-
40
-
41
-
42
-
43
-
44
-
45
-
46
-
47
-
48
-
49
-
50
-
51
-
52
-
53
-
54
-
55
-
56
-
57
-
58
-
59
-
60
-
61
-
62
-
63
-
64
-
65
-
66
-
67
-
68
-
69
-
70
-
71
-
72
-
73
-
74
-
75
-
76
-
77
-
78
-
79
-
80
-
81
-
82
-
83
-
84
-
85
-
86
-
87
-
88
-
89
-
90
-
91
-
92
-
93
-
94
-
95
-
96
-
97
-
98
-
99
-
100
-
101
-
102
-
103
-
104
-
105
-
106
-
107
-
108
-
109
-
110
-
111
-
112
-
113
-
114
-
115
-
116
-
117
-
118
-
119
-
120
-
121
-
122
-
123
-
124
-
125
-
126
-
127
-
128
-
129
-
130
-
131
-
 132
132 -
 133
133 -
 134
134 -
 135
135 -
 136
136 -
 137
137 -
 138
138 -
 139
139 -
 140
140 -
 141
141 -
 142
142 -
 143
143 -
 144
144 -
 145
145 -
 146
146 -
 147
147 -
 148
148 -
 149
149 -
 150
150 -
 151
151 -
 152
152 -
153
-
154
-
155
-
156
-
157
-
158
-
159
-
160
-
161
-
162
-
163
-
164
-
165
-
166
-
167
-
168
-
169
-
170
-
171
-
172
-
173
-
174
-
175
-
176
-
177
-
178
-
179
-
180
-
181
-
182
-
183
-
184
-
185
-
186
-
187
-
188
-
189
-
190
-
191
-
192
-
193
-
194
-
195
-
196
-
197
-
198
-
199
-
200
-
201
-
202
-
203
-
204
-
205
-
206
-
207
-
208
-
209
-
210
-
211
-
212
-
213
-
214
-
215
-
216
-
217
-
218
-
219
-
220
-
221
-
222
-
223
-
224
-
225
-
226
-
227
-
228
-
229
-
230
-
231
-
232
-
233
-
234
-
235
-
236
-
237
-
238
-
239
-
240
-
241
-
242
-
243
-
244
-
245
-
246
-
247
-
248
-
249
-
250
-
251
-
252
-
253
-
254
-
255
-
256
 |
 |
PINNACLE WEST CAPITAL CORPORATION
NOTES TO CONSOLIDATED FINANCIAL STATEMENTS
117
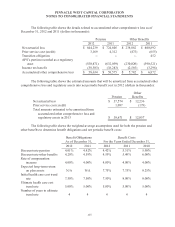
Based on the IPS, and given the pension plan’s funded status at year-end 2012, the long-term
fixed income assets and the return generating assets each had a target allocation of 50%. The return-
generating assets have additional target allocations, as a percent of total plan assets, of 30% equities in
U.S. and other developed markets, 6% equities in emerging markets, and 14% in alternative
investments. The pension plan IPS does not provide for a specific mix of long-term fixed income
assets, but does expect the average credit quality of such assets to be investment grade. As of
December 31, 2012, long-term fixed income assets represented 44% of total pension plan assets, and
return-generating assets represented 56% of total pension plan assets.
The asset allocation for other postretirement benefit plan assets is governed by the IPS for those
plans, which provides for an asset allocation target mix of at least 25% of fixed income assets and 55%
or less of non-fixed income assets. This asset allocation target mix does not vary with the plan’s funded
status. As of December 31, 2012, investment in fixed income assets represented 45% of the other
postretirement benefit plan total assets, and non-fixed income assets represent 55% of the other
postretirement benefit plan’s assets. Fixed income assets are primarily invested in corporate bonds of
investment-grade U.S. issuers, and U.S. Treasuries. Non-fixed income assets are primarily invested in
large cap U.S. equities in diverse industries, and international equities in both emerging and developed
markets.
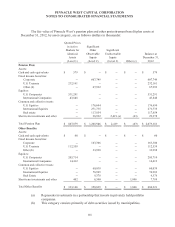
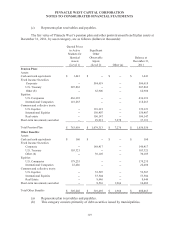
See Note 14 for a discussion on the fair value hierarchy and how fair value methodologies are
applied. The plans invest directly in fixed income and equity securities, in addition to investing
indirectly in equity securities and real estate through the use of common and collective trusts. Equity
securities held directly by the plans are valued using quoted active market prices from the published
exchange on which the equity security trades, and are classified as Level 1. Fixed income securities
issued by the U.S. Treasury held directly by the plans are valued using quoted active market prices, and
are classified as Level 1. Fixed income securities issued by corporations, municipalities, and other
agencies are primarily valued using quoted inactive market prices, or quoted active market prices for
similar securities, or by utilizing calculations which incorporate observable inputs such as yield,
maturity and credit quality. These instruments are classified as Level 2.
The common and collective trusts, which are similar to mutual funds, are maintained by banks
or investment companies and hold certain investments in accordance with a stated set of objectives
(such as tracking the performance of the S&P 500 index). The common and collective equity trusts are
valued using the concept of net asset value (“NAV”), which is a value derived from the quoted active
market prices of the underlying securities. The plans’ common and collective real estate trust is valued
using NAV, which is derived from the appraised values of the trust’s underlying real estate assets. As
of December 31, 2012 the plans were able to transact in the common and collective trusts at NAV and
accordingly classify these investments as Level 2. Because the trust’s shares are offered to a limited
group of investors, they are not considered to be traded in an active market.
The plans’ trustee provides valuation of our plan assets by using pricing services that utilize
methodologies described to determine fair market value. We have internal control procedures to ensure
this information is consistent with fair value accounting guidance. These procedures include assessing
valuations using an independent pricing source, verifying that pricing can be supported by actual recent
market transactions, assessing hierarchy classifications, comparing investment returns with benchmarks,
and obtaining and reviewing independent audit reports on the trustee’s internal operating controls and
valuation processes.