ICICI Bank 2006 Annual Report Download - page 92
Download and view the complete annual report
Please find page 92 of the 2006 ICICI Bank annual report below. You can navigate through the pages in the report by either clicking on the pages listed below, or by using the keyword search tool below to find specific information within the annual report.-
 1
1 -
2
-
3
-
4
-
5
-
6
-
7
-
8
-
9
-
10
-
11
-
12
-
13
-
14
-
15
-
16
-
17
-
18
-
19
-
20
-
21
-
22
-
23
-
24
-
25
-
26
-
27
-
28
-
29
-
30
-
31
-
32
-
33
-
34
-
35
-
36
-
37
-
38
-
39
-
40
-
41
-
42
-
43
-
44
-
45
-
46
-
47
-
48
-
49
-
50
-
51
-
52
-
53
-
54
-
55
-
56
-
57
-
58
-
59
-
60
-
61
-
62
-
63
-
64
-
65
-
66
-
67
-
68
-
69
-
70
-
71
-
72
-
73
-
74
-
75
-
76
-
77
-
78
-
79
-
80
-
81
-
 82
82 -
 83
83 -
 84
84 -
 85
85 -
 86
86 -
 87
87 -
 88
88 -
 89
89 -
 90
90 -
 91
91 -
 92
92 -
 93
93 -
 94
94 -
 95
95 -
 96
96 -
 97
97 -
 98
98 -
 99
99 -
 100
100 -
 101
101 -
 102
102 -
103
-
104
-
105
-
106
-
107
-
108
-
109
-
110
-
111
-
112
-
113
-
114
-
115
-
116
-
117
-
118
-
119
-
120
-
121
-
122
-
123
-
124
-
125
-
126
-
127
-
128
-
129
-
130
-
131
-
132
-
133
-
134
-
135
-
136
-
137
 |
 |

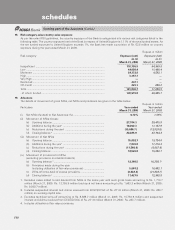
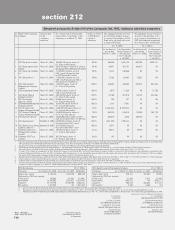
F33
Rupees in million
As on March 31, 2005
Sr. Currency Interest
No. Particular derivatives 1 rate derivatives 2
1. Derivatives (Notional principal amount)
a) For hedging ................................................................................ 8,083.1 106,428.6
b) For trading .................................................................................. 274,325.6 1,335,689.1
2. Marked to market positions 3
a) Asset (+) .................................................................................... 442.0 564.7
b) Liability (-) ................................................................................... — —
3. Credit exposure ................................................................................. 9,373.9 18,124.4
4. Likely impact of one percentage change in interest rate (100*PV01)
a) on hedging derivatives 4............................................................ (79.4) (22.1)
b) on trading derivatives ................................................................ 880.7 (534.5)
5. Maximum and minimum of 100*PV01 observed during the year
a) on hedging 4
Maximum ................................................................................... (38.2) 2.8
Minimum.................................................................................... (101.5) (1,675.1)
b) on trading
Maximum ................................................................................... 1,280.6 180.8
Minimum.................................................................................... 156.6 (1,081.3)
1. Options & cross currency interest rate swaps are included in currency derivatives.
2. Foreign currency interest rate swaps and forward rate agreements are included in interest rate derivatives.
3. For trading portfolio.
4. The swap contracts entered for hedging purpose have an opposite and offsetting impact with the underlying on-balance
sheet items.
The notional principal amount of credit derivatives outstanding at March 31, 2006 was Rs. 23,514.4 million (March 31, 2005:
Rs. 3,937.1 million).
The notional principal amount of forex contracts classified as hedging amounted to Rs. 165,041.4 million (March 31, 2005:
Rs. 60,340.1 million). The notional principal amount of forex contracts classified as trading amounted to Rs. 753,273.6
million (March 31, 2005: Rs. 609,304.1 million).
The net overnight open position at March 31, 2006 is Rs. 457.8 million (March 31, 2005: Rs. 190.7 million).
31. Forward rate agreement (“FRA”)/ Interest rate swaps (“IRS”)
The notional principal amount of Rupee IRS contracts at March 31, 2006 is Rs. Nil for hedging contracts (March 31, 2005:
Rs.51,100.0 million) and Rs. 1,870,025.6 million for trading contracts (March 31, 2005: Rs. 1,114,302.0 million).
The fair value represents the estimated replacement cost of swap contracts at balance sheet date. At March 31, 2006 the
fair value of trading rupee interest rate swap contracts is Rs. 922.4 million (March 31, 2005: Rs. 333.6 million).
Associated credit risk is the loss that the Bank would incur in case all the counter-parties to these swaps fail to fulfil their
contractual obligations. At March 31, 2006, the associated credit risk on trading rupee interest rate swap contracts is
Rs. 16,754.4 million (March 31, 2005: Rs. 9,865.3 million).
Market risk is monitored as the loss that would be incurred by the Bank for a 100 basis points change in the interest rates.
At March 31, 2006 the market risk on trading rupee interest rate swap contracts amounts to Rs. 1,192.3 million (March 31,
2005: Rs. 137.8 million).
Credit risk concentration is measured as the highest net receivable under swap contracts from a particular counter-party. At
March 31, 2006 there is a credit risk concentration of Rs. 476.4 million (March 31, 2005: Rs. 274.6 million) under rupee
interest rate swap contracts, with ICICI Securities. As per the prevailing market practice, the Bank does not insist on
collateral from the counter-parties in these contracts.
forming part of the Accounts (Contd.)
schedules