ICICI Bank 2006 Annual Report Download - page 50
Download and view the complete annual report
Please find page 50 of the 2006 ICICI Bank annual report below. You can navigate through the pages in the report by either clicking on the pages listed below, or by using the keyword search tool below to find specific information within the annual report.-
 1
1 -
2
-
3
-
4
-
5
-
6
-
7
-
8
-
9
-
10
-
11
-
12
-
13
-
14
-
15
-
16
-
17
-
18
-
19
-
20
-
21
-
22
-
23
-
24
-
25
-
26
-
27
-
28
-
29
-
30
-
31
-
32
-
33
-
34
-
35
-
36
-
37
-
38
-
39
-
 40
40 -
 41
41 -
 42
42 -
 43
43 -
 44
44 -
 45
45 -
 46
46 -
 47
47 -
 48
48 -
 49
49 -
 50
50 -
 51
51 -
 52
52 -
 53
53 -
 54
54 -
 55
55 -
 56
56 -
 57
57 -
 58
58 -
 59
59 -
 60
60 -
61
-
62
-
63
-
64
-
65
-
66
-
67
-
68
-
69
-
70
-
71
-
72
-
73
-
74
-
75
-
76
-
77
-
78
-
79
-
80
-
81
-
82
-
83
-
84
-
85
-
86
-
87
-
88
-
89
-
90
-
91
-
92
-
93
-
94
-
95
-
96
-
97
-
98
-
99
-
100
-
101
-
102
-
103
-
104
-
105
-
106
-
107
-
108
-
109
-
110
-
111
-
112
-
113
-
114
-
115
-
116
-
117
-
118
-
119
-
120
-
121
-
122
-
123
-
124
-
125
-
126
-
127
-
128
-
129
-
130
-
131
-
132
-
133
-
134
-
135
-
136
-
137
 |
 |
49
Annual Report 2005-2006
ICICI Bank’s total capital adequacy at March 31, 2006 was 13.35%, including Tier-I capital adequacy of
9.20% and Tier-II capital adequacy of 4.15%. In accordance with the RBI guidelines, the risk weighted
assets at March 31, 2006 include home loans to individuals at a risk weightage of 75% and other consumer
loans at a risk weightage of 125%. Capital market exposure and commercial real estate exposure have
been considered at a risk weightage of 125%. The risk-weighted assets at March 31, 2006 also include
the impact of capital requirement for market risk on the “Held for Trading” (HFT) and “Available for Sale”
(AFS) portfolio.
RBI has vide its circular DBOD.No.BP.BC.38/21.04.141/2005-06 dated October 10, 2005 permitted banks
that have maintained capital of at least 9.0% of the risk-weighted assets for credit risk and market risk for
held for trading and available for sale categories of investments at March 31, 2006, to transfer the balance
in the Investment Fluctuation Reserve (IFR) ‘below the line’ in the profit and loss appropriation account to
statutory reserve, general reserve or balance of profit & loss account. Pursuant to the above, the entire
balance in IFR at March 31, 2006, of Rs. 13.20 billion has been transferred from IFR to Revenue and other
Reserves and hence is considered in the Tier-I capital of the Bank.
For all securitisation deals executed subsequent to February 1, 2006, capital requirement has been
considered in accordance with the RBI guidelines issued in this regard on February 1, 2006. Deferred tax
asset of Rs. 1.64 billion and unamortised expense of Rs. 0.89 billion on account of the early retirement
option in 2003 has also been reduced from Tier-I capital. In accordance with RBI guidelines, Tier-I capital
includes Rs. 1.50 billion out of the face value of Rs. 3.50 billion of 20 year non-cumulative preference
shares issued to ITC Limited as a part of the scheme for merger of ITC Classic Finance Limited with ICICI.
At March 31, 2006 the Bank had not issued any hybrid Tier-I or upper Tier-II instruments.
ASSET QUALITY AND COMPOSITION
Loan Portfolio
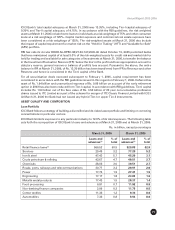
ICICI Bank follows a strategy of building a diversified and de-risked asset portfolio and limiting or correcting
concentrations in particular sectors.
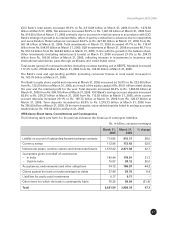
ICICI Bank limits its exposure to any particular industry to 12.0% of its total exposure. The following table
sets forth the composition of ICICI Bank’s loans and advances at March 31, 2005 and at March 31, 2006.
Rs. in billion, except percentages
March 31, 2005 March 31, 2006
Loans and % of Loans and % of
advances(1) total advances(1) total
Retail finance loans(2) 566.52 60.9 929.08 62.9
Services 29.49 3.2 77.29 5.2
Iron & steel 47.43 5.1 45.29 3.1
Crude petroleum & refining 43.67 4.7 40.51 2.7
Chemicals 28.03 3.0 39.51 2.7
Roads, ports, railways and telecommunications 30.77 3.3 29.91 2.0
Power 17.75 1.9 27.41 1.9
Engineering 17.17 1.8 23.03 1.6
Metal & metal products 17.43 1.9 20.37 1.4
Food processing 6.81 0.7 11.92 0.8
Non-banking finance companies 2.06 0.2 11.78 0.8
Cotton textiles 11.33 1.2 9.36 0.6
Automobiles 7.33 0.8 8.94 0.6