ICICI Bank 2006 Annual Report Download - page 86
Download and view the complete annual report
Please find page 86 of the 2006 ICICI Bank annual report below. You can navigate through the pages in the report by either clicking on the pages listed below, or by using the keyword search tool below to find specific information within the annual report.-
 1
1 -
2
-
3
-
4
-
5
-
6
-
7
-
8
-
9
-
10
-
11
-
12
-
13
-
14
-
15
-
16
-
17
-
18
-
19
-
20
-
21
-
22
-
23
-
24
-
25
-
26
-
27
-
28
-
29
-
30
-
31
-
32
-
33
-
34
-
35
-
36
-
37
-
38
-
39
-
40
-
41
-
42
-
43
-
44
-
45
-
46
-
47
-
48
-
49
-
50
-
51
-
52
-
53
-
54
-
55
-
56
-
57
-
58
-
59
-
60
-
61
-
62
-
63
-
64
-
65
-
66
-
67
-
68
-
69
-
70
-
71
-
72
-
73
-
74
-
75
-
 76
76 -
 77
77 -
 78
78 -
 79
79 -
 80
80 -
 81
81 -
 82
82 -
 83
83 -
 84
84 -
 85
85 -
 86
86 -
 87
87 -
 88
88 -
 89
89 -
 90
90 -
 91
91 -
 92
92 -
 93
93 -
 94
94 -
 95
95 -
 96
96 -
97
-
98
-
99
-
100
-
101
-
102
-
103
-
104
-
105
-
106
-
107
-
108
-
109
-
110
-
111
-
112
-
113
-
114
-
115
-
116
-
117
-
118
-
119
-
120
-
121
-
122
-
123
-
124
-
125
-
126
-
127
-
128
-
129
-
130
-
131
-
132
-
133
-
134
-
135
-
136
-
137
 |
 |

F27
forming part of the Accounts (Contd.)
schedules
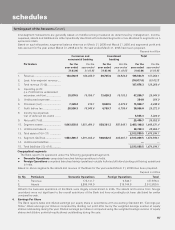
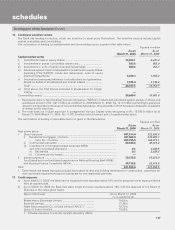
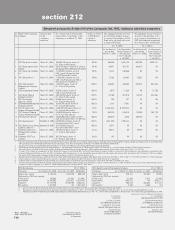
16. Lending to sensitive sectors
The Bank has lending to sectors, which are sensitive to asset price fluctuations. The sensitive sectors include capital
market, real estate and commodities.
The net position of lending to capital market and commodities sector is given in the table below. Rupees in million
As on As on
March 31, 2006 March 31, 2005
Capital market sector
i) Investments made in equity shares .................................................. 14,453.1 9,231.4
ii) Investments in bonds / convertible debentures ................................ 583.8 585.0
iii) Investments in units of equity–oriented mutual funds ..................... 200.6 252.7
iv) Advances against share to individuals for investment in equity shares
(including IPOs /ESOPS), bonds and debentures, units of equity
oriented mutual funds1.......................................................................................................................... 5,470.1 1,563.2
v) Secured and unsecured advances to stockbrokers and guarantees
issued on behalf of stockbrokers and market makers ...................... 7,485.9 5,120.4
Total2.................................................................................................. 28,193.5 16,752.7
vi) Of (v) above, the total finance extended to stockbrokers for margin
trading ................................................................................................ ——
Commodities sector .................................................................................. 29,849.4 10,061.0
1. Represents loans to Non-Banking Financial Companies (“NBFCs”), brokers and individuals against pledge of shares and
includes an amount of Rs. 102.7 million as on March 31, 2006 (March 31, 2005: Rs. 141.0 million) pertaining to guarantee
issued to a corporate for the issue of non-convertible debentures, the proceeds of which have been utilised for acquisition
of shares by the corporate.
2. The total does not include exposure in unregistered Venture Capital funds amounting to Rs. 16,149.9 million as of
March 31, 2006 (March 31, 2005: Rs. 11,761.6 million) which forms a part of capital market sector.
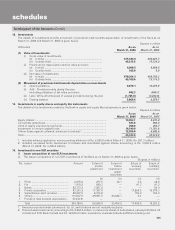
The net position of lending to real estate sector is given in the table below. Rupees in million
As on As on
March 31, 2006 March 31, 2005
Real estate sector
I Direct exposure ..................................................................................................... 501,514.8 322,930.6
i) Residential mortgages, of which ................................................................... 431,668.5 274,883.7
- Upto Rs. 1.5 million ............................................................................... 263,796.5 166,413.1
ii) Commercial real estate1................................................................................. 69,846.0 45,618.4
iii) Investments in mortgage backed securities (MBS)
and other securitised exposures ................................................................... 0.3 2,428.5
a) Residential ............................................................................................. 0.3 2,428.5
b) Commercial real estate .......................................................................... ——
II Indirect exposure ................................................................................................... 30,135.8 52,619.9
Fund based and non-fund based exposures on National Housing Bank (NHB)
and Housing Finance Companies (HFCs) .............................................................. 30,135.8 52,619.9
Total 531,650.6 375,550.5
1. Commercial real estate exposure includes loans given to land and building developers for construction, corporates for
their real estate requirements and to individuals for non-residential premises.
17. Credit exposure
a) As on March 31, 2006, the Bank had no single borrower exposure above 15% and no group borrower exposure above
40% of capital funds.
b) As on March 31, 2005 the Bank had taken single borrower exposure above 15% with the approval of the Board of
Directors in the cases given below.
Name of Borrower As on March 31, 2005
% to capital funds
Bharat Heavy Electricals Limited ............................................ 19.50%
Essar Oil Limited ..................................................................... 17.46%
Asset Reconstruction Co. of India Limited (“ARCIL”) 1........... 16.73%
Larsen & Toubro Limited ......................................................... 16.20%
1. Includes exposure to security receipts issued by ARCIL.