ICICI Bank 2006 Annual Report Download - page 23
Download and view the complete annual report
Please find page 23 of the 2006 ICICI Bank annual report below. You can navigate through the pages in the report by either clicking on the pages listed below, or by using the keyword search tool below to find specific information within the annual report.-
 1
1 -
2
-
3
-
4
-
5
-
6
-
7
-
8
-
9
-
10
-
11
-
12
-
 13
13 -
 14
14 -
 15
15 -
 16
16 -
 17
17 -
 18
18 -
 19
19 -
 20
20 -
 21
21 -
 22
22 -
 23
23 -
 24
24 -
 25
25 -
 26
26 -
 27
27 -
 28
28 -
 29
29 -
 30
30 -
 31
31 -
 32
32 -
 33
33 -
34
-
35
-
36
-
37
-
38
-
39
-
40
-
41
-
42
-
43
-
44
-
45
-
46
-
47
-
48
-
49
-
50
-
51
-
52
-
53
-
54
-
55
-
56
-
57
-
58
-
59
-
60
-
61
-
62
-
63
-
64
-
65
-
66
-
67
-
68
-
69
-
70
-
71
-
72
-
73
-
74
-
75
-
76
-
77
-
78
-
79
-
80
-
81
-
82
-
83
-
84
-
85
-
86
-
87
-
88
-
89
-
90
-
91
-
92
-
93
-
94
-
95
-
96
-
97
-
98
-
99
-
100
-
101
-
102
-
103
-
104
-
105
-
106
-
107
-
108
-
109
-
110
-
111
-
112
-
113
-
114
-
115
-
116
-
117
-
118
-
119
-
120
-
121
-
122
-
123
-
124
-
125
-
126
-
127
-
128
-
129
-
130
-
131
-
132
-
133
-
134
-
135
-
136
-
137
 |
 |

22
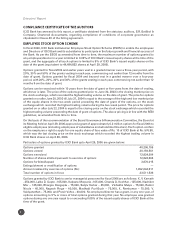
ICICI Bank has paid annual listing fees for the relevant periods on its capital to BSE, NSE and NYSE where
its securities are listed.
Market Price Information
The reported high and low closing prices and volume of equity shares of ICICI Bank traded during fiscal
2006 on BSE and NSE are set out in the following table:
BSE NSE Total
volume
High Low High Low on BSE
Month (Rs.) (Rs.) Volume (Rs.) (Rs.) Volume and NSE
April 2005 424.55 360.20 20,274,502 425.45 359.95 25,015,675 45,290,177
May 2005 402.70 361.50 16,828,805 402.55 360.35 10,167,111 26,995,916
June 2005 432.55 392.25 24,779,603 433.95 392.15 12,585,888 37,365,491
July 2005 536.00 421.30 20,546,843 534.45 421.25 21,794,366 42,341,209
August 2005 533.30 471.75 12,981,543 538.40 467.95 15,852,115 28,833,658
September 2005 600.35 481.75 25,243,607 601.70 481.50 20,216,088 45,459,695
October 2005 593.30 480.65 29,471,237 593.40 479.90 29,451,947 58,923,184
November 2005 545.65 497.15 14,085,747 545.40 498.65 18,523,954 32,609,701
December 2005 587.80 529.95 24,402,507 586.55 529.90 41,803,529 66,206,036
January 2006 619.35 559.25 35,112,507 619.55 559.15 47,644,009 82,756,516
February 2006 627.95 570.60 17,861,030 628.75 570.95 25,134,188 42,995,218
March 2006 620.15 589.25 26,151,336 620.40 588.70 14,532,479 40,683,815
Fiscal 2006 627.95 360.20 267,739,267 628.75 359.95 282,721,349 550,460,616
Note : For BSE, the high and low closing prices are for scrip code 532174 and volumes are aggregated volumes for scrip
codes 532174 and 632174.
Source: BSE and NSE.
The reported high and low closing prices and volume of ADSs of ICICI Bank traded during fiscal 2006 on
the NYSE are given below:
Month High (US$) Low (US$) Number of
ADSs traded
April 2005 20.75 18.08 12,077,000
May 2005 20.21 18.50 10,018,900
June 2005 22.23 19.80 12,578,200
July 2005 26.41 22.00 12,320,300
August 2005 25.65 22.77 14,794,000
September 2005 28.25 23.35 16,376,400
October 2005 27.78 22.04 18,001,200
November 2005 25.67 23.59 14,797,100
December 2005 29.47 26.23 22,146,400
January 2006 32.00 28.44 22,690,100
February 2006 31.91 29.93 15,133,800
March 2006 32.26 27.68 20,280,900
Fiscal 2006 32.26 18.08 191,214,300
Source: Yahoo Finance.
Directors’ Report