ICICI Bank 2006 Annual Report Download - page 121
Download and view the complete annual report
Please find page 121 of the 2006 ICICI Bank annual report below. You can navigate through the pages in the report by either clicking on the pages listed below, or by using the keyword search tool below to find specific information within the annual report.-
 1
1 -
2
-
3
-
4
-
5
-
6
-
7
-
8
-
9
-
10
-
11
-
12
-
13
-
14
-
15
-
16
-
17
-
18
-
19
-
20
-
21
-
22
-
23
-
24
-
25
-
26
-
27
-
28
-
29
-
30
-
31
-
32
-
33
-
34
-
35
-
36
-
37
-
38
-
39
-
40
-
41
-
42
-
43
-
44
-
45
-
46
-
47
-
48
-
49
-
50
-
51
-
52
-
53
-
54
-
55
-
56
-
57
-
58
-
59
-
60
-
61
-
62
-
63
-
64
-
65
-
66
-
67
-
68
-
69
-
70
-
71
-
72
-
73
-
74
-
75
-
76
-
77
-
78
-
79
-
80
-
81
-
82
-
83
-
84
-
85
-
86
-
87
-
88
-
89
-
90
-
91
-
92
-
93
-
94
-
95
-
96
-
97
-
98
-
99
-
100
-
101
-
102
-
103
-
104
-
105
-
106
-
107
-
108
-
109
-
110
-
 111
111 -
 112
112 -
 113
113 -
 114
114 -
 115
115 -
 116
116 -
 117
117 -
 118
118 -
 119
119 -
 120
120 -
 121
121 -
 122
122 -
 123
123 -
 124
124 -
 125
125 -
 126
126 -
 127
127 -
 128
128 -
 129
129 -
 130
130 -
 131
131 -
132
-
133
-
134
-
135
-
136
-
137
 |
 |

F62
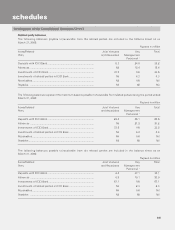
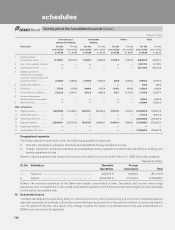
The following balances represent the maximum balance payable to/receivable from related parties during the year ended
March 31, 2005:
Rupees in million
Items/Related Joint Ventures Key Total
Party and Associates Management
Personnel 1
Deposits with ICICI Bank ................................................................ 64.5 196.1 260.6
Advances ........................................................................................ 0.9 19.1 20.0
Investments of ICICI Bank .............................................................. 67.1 Nil 67.1
Investments of related parties in ICICI Bank .................................. Nil 2.3 2.3
Receivables ..................................................................................... Nil Nil Nil
Payables ........................................................................................ Nil Nil Nil
1. Whole- time directors of the Board and their relatives.
Joint ventures and associates
For the year ended March 31, 2006, TCW/ICICI Investment Partners LLC and TSI Ventures (India) Private Limited have been
classified as joint ventures. For the period ended March 31, 2005, Prudential ICICI Asset Management Company Limited
and Prudential ICICI Trust Limited have been classified as joint ventures. These entities have been accounted as “subsidiaries”
as defined in AS 21 “Consolidated Financial Statement” in the current financial year.
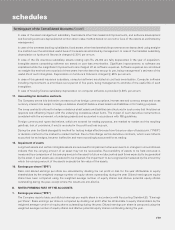
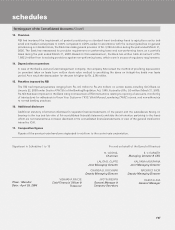
3. Employee Stock Option Scheme (”ESOS”)
In terms of the ESOS, as amended, the maximum number of options granted to any eligible employee in a financial year
shall not exceed 0.05% of the issued equity shares of the Bank at the time of grant of the options and aggregate of all such
options granted to the eligible employees shall not exceed 5% of the aggregate number of the issued equity shares of the
Bank on the date(s) of the grant of options.
In terms of the Scheme, 17,362,584 options (March 31, 2005: 18,215,335 options) granted to eligible employees were
outstanding at March 31, 2006.
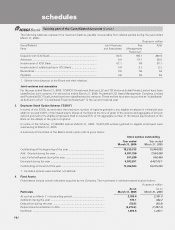
A summary of the status of the Bank’s stock option plan is given below:
Stock options outstanding
Year ended Year ended
March 31, 2006 March 31, 2005
Outstanding at the beginning of the year ................................................. 18,215,335 15,964,982
Add: Granted during the year ................................................................... 4,981,780 7,554,500
Less: Forfeited/lapsed during the year ...................................................... 931,280 846,496
Exercised during the year .......................................................................... 4,903,251 4,457,6511
Outstanding at the end of the year ........................................................... 17,362,584 18,215,335
1. Excludes options exercised but not allotted.
4. Fixed Assets
Fixed assets include certain softwares acquired by the Company. The movement in software assets is given below:
Rupees in million
As on As on
Particulars March 31, 2006 March 31, 2005
At cost as on March 31 of preceding period............................................. 2,784.4 2,381.0
Additions during the year .......................................................................... 615.1 462.2
Deductions during the year ....................................................................... (52.5) (58.8)
Depreciation/amortisation to date ............................................................. (2,274.2) (1,557.3)
Net Block ................................................................................................... 1,072.8 1,227.1
schedules
forming part of the Consolidated Accounts (Contd.)