ICICI Bank 2006 Annual Report Download - page 69
Download and view the complete annual report
Please find page 69 of the 2006 ICICI Bank annual report below. You can navigate through the pages in the report by either clicking on the pages listed below, or by using the keyword search tool below to find specific information within the annual report.-
 1
1 -
2
-
3
-
4
-
5
-
6
-
7
-
8
-
9
-
10
-
11
-
12
-
13
-
14
-
15
-
16
-
17
-
18
-
19
-
20
-
21
-
22
-
23
-
24
-
25
-
26
-
27
-
28
-
29
-
30
-
31
-
32
-
33
-
34
-
35
-
36
-
37
-
38
-
39
-
40
-
41
-
42
-
43
-
44
-
45
-
46
-
47
-
48
-
49
-
50
-
51
-
52
-
53
-
54
-
55
-
56
-
57
-
58
-
 59
59 -
 60
60 -
 61
61 -
 62
62 -
 63
63 -
 64
64 -
 65
65 -
 66
66 -
 67
67 -
 68
68 -
 69
69 -
 70
70 -
 71
71 -
 72
72 -
 73
73 -
 74
74 -
 75
75 -
 76
76 -
 77
77 -
 78
78 -
 79
79 -
80
-
81
-
82
-
83
-
84
-
85
-
86
-
87
-
88
-
89
-
90
-
91
-
92
-
93
-
94
-
95
-
96
-
97
-
98
-
99
-
100
-
101
-
102
-
103
-
104
-
105
-
106
-
107
-
108
-
109
-
110
-
111
-
112
-
113
-
114
-
115
-
116
-
117
-
118
-
119
-
120
-
121
-
122
-
123
-
124
-
125
-
126
-
127
-
128
-
129
-
130
-
131
-
132
-
133
-
134
-
135
-
136
-
137
 |
 |

F10
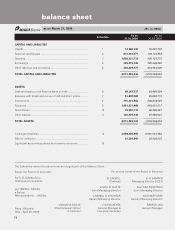
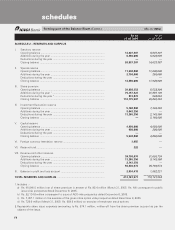
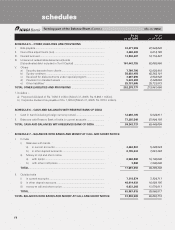
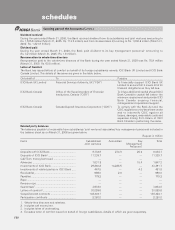
SCHEDULE 10 – FIXED ASSETS
I. Premises
At cost as on March 31 of preceding year ................................................ 18,829,741 16,668,982
Additions during the year .......................................................................... 1,454,189 2,254,384
Deductions during the year ....................................................................... (84,491) (93,625)
Depreciation to date .................................................................................. (2,029,015) (1,516,102)
Net block ................................................................................................... 18,170,424 17,313,639
II. Other fixed assets (including furniture and fixtures)
At cost as on March 31 of preceding year ................................................ 16,303,939 13,587,781
Additions during the year .......................................................................... 4,361,180 2,826,608
Deductions during the year ....................................................................... (133,227) (110,450)
Depreciation to date .................................................................................. (10,633,404) (7,765,842)
Net block ................................................................................................... 9,898,488 8,538,097
III. Assets given on lease
At cost as on March 31 of preceding year ................................................ 20,122,827 20,645,237
Additions during the year .......................................................................... 544 2,838
Deductions during the year ....................................................................... (1,169,048) (525,248)
Depreciation to date, accumulated lease adjustment and provisions ...... (7,216,120) (5,594,202)
Net block ................................................................................................... 11,738,203 14,528,625
TOTAL FIXED ASSETS ..................................................................................... 39,807,115 40,380,361
SCHEDULE 11 – OTHER ASSETS
I. Inter-office adjustments (net) .................................................................... ——
II. Interest accrued ......................................................................................... 21,543,081 13,124,389
III. Tax paid in advance/tax deducted at source (net) ..................................... 28,220,490 26,643,957
IV. Stationery and stamps ............................................................................... 1,663 3,609
V. Non-banking assets acquired in satisfaction of claims 1........................... 3,627,879 3,677,234
VI. Others
a) Advance for capital assets................................................................. 1,479,423 963,017
b) Outstanding fees and other Income ................................................. 3,676,895 2,792,942
c) Exchange fluctuation suspense with Government of India .............. 24,966 244,749
d) Swap suspense ................................................................................. 71,587 794,710
e) Deposits ............................................................................................. 25,766,974 15,003,770
f) Deferred tax asset (net) ..................................................................... 1,642,837 148,666
g) Early retirement option expenses not written off ............................. 885,979 1,269,979
h) Others ................................................................................................ 39,633,375 23,321,905
TOTAL OTHER ASSETS.................................................................................... 126,575,149 87,988,927
1.Includes certain non-banking assets acquired in satisfaction of claims which are in the process of being transferred in the
Banks’ name.
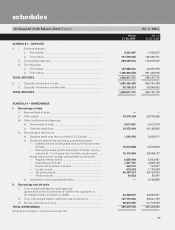
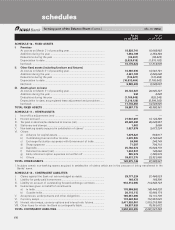
SCHEDULE 12 – CONTINGENT LIABILITIES
I. Claims against the Bank not acknowledged as debts .............................. 29,777,239 27,464,523
II. Liability for partly paid investments........................................................... 168,472 168,396
III. Liability on account of outstanding forward exchange contracts ............. 918,314,985 714,848,723
IV. Guarantees given on behalf of constituents
a) In India ............................................................................................... 170,909,502 140,444,828
b) Outside India...................................................................................... 20,118,115 15,968,174
V. Acceptances, endorsements and other obligations ................................. 106,867,498 74,115,736
VI. Currency swaps ......................................................................................... 172,422,863 112,957,025
VII. Interest rate swaps, currency options and interest rate futures ............... 2,471,920,061 1,519,218,305
VIII. Other items for which the Bank is contingently liable .............................. 59,837,920 76,351,672
TOTAL CONTINGENT LIABILITIES .................................................................. 3,950,336,655 2,681,537,382
schedules
forming part of the Balance Sheet (Contd.) (Rs. in ‘000s)
As on As on
31.03.2006 31.03.2005