ICICI Bank 2006 Annual Report Download - page 75
Download and view the complete annual report
Please find page 75 of the 2006 ICICI Bank annual report below. You can navigate through the pages in the report by either clicking on the pages listed below, or by using the keyword search tool below to find specific information within the annual report.-
 1
1 -
2
-
3
-
4
-
5
-
6
-
7
-
8
-
9
-
10
-
11
-
12
-
13
-
14
-
15
-
16
-
17
-
18
-
19
-
20
-
21
-
22
-
23
-
24
-
25
-
26
-
27
-
28
-
29
-
30
-
31
-
32
-
33
-
34
-
35
-
36
-
37
-
38
-
39
-
40
-
41
-
42
-
43
-
44
-
45
-
46
-
47
-
48
-
49
-
50
-
51
-
52
-
53
-
54
-
55
-
56
-
57
-
58
-
59
-
60
-
61
-
62
-
63
-
64
-
 65
65 -
 66
66 -
 67
67 -
 68
68 -
 69
69 -
 70
70 -
 71
71 -
 72
72 -
 73
73 -
 74
74 -
 75
75 -
 76
76 -
 77
77 -
 78
78 -
 79
79 -
 80
80 -
 81
81 -
 82
82 -
 83
83 -
 84
84 -
 85
85 -
86
-
87
-
88
-
89
-
90
-
91
-
92
-
93
-
94
-
95
-
96
-
97
-
98
-
99
-
100
-
101
-
102
-
103
-
104
-
105
-
106
-
107
-
108
-
109
-
110
-
111
-
112
-
113
-
114
-
115
-
116
-
117
-
118
-
119
-
120
-
121
-
122
-
123
-
124
-
125
-
126
-
127
-
128
-
129
-
130
-
131
-
132
-
133
-
134
-
135
-
136
-
137
 |
 |

F16
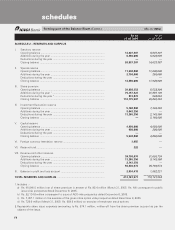
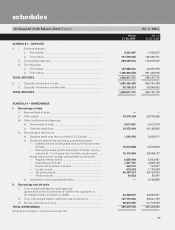
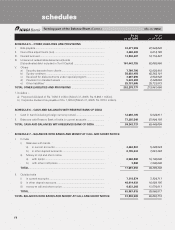
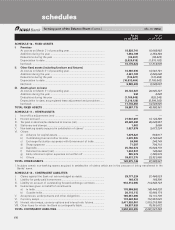
forming part of the Accounts (Contd.)
schedules
reviewed at each balance sheet date and adjusted to reflect the current management estimates. In cases where the available
information indicates that the loss on the contingency is reasonably possible but the amount of loss cannot be reasonably
estimated, a disclosure is made in the financial statements. In case of remote possibility neither provision nor disclosure is
made in the financial statements.
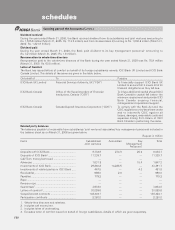
13. Earnings Per Share (“EPS”)
Basic and diluted earnings per share are calculated by dividing the net profit or loss for the year attributable to equity
shareholders by the weighted average number of equity shares outstanding during the year. Diluted earnings per equity
share has been computed using the weighted average number of equity shares and dilutive potential equity shares outstanding
during the period, except where the results are anti-dilutive.
14. Cash and cash equivalents
Cash and cash equivalents include cash in hand, balances with RBI, balances with other banks and money at call and short
notice.
B. NOTES FORMING PART OF THE ACCOUNTS
The following additional disclosures have been made taking into account RBI guidelines in this regard.
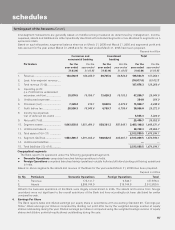
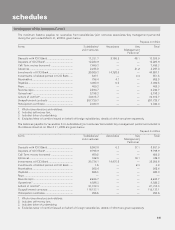
1. Capital adequacy ratio
The capital to risk weighted assets ratio (“CRAR”) as assessed by the Bank on the basis of the financial statements and
guidelines issued by RBI is given in the table below.
Rupees in million
As on As on
March 31, 2006 March 31, 2005
Tier I capital ................................................................................................ 191,815.3 102,463.2
Tier II capital ............................................................................................... 86,610.9 56,566.1
Total capital ................................................................................................ 278,426.2 159,029.3
Total risk weighted assets ......................................................................... 2,085,935.9 1,350,168.1
CRAR (%) ................................................................................................... 13.35% 11.78%
CRAR – Tier I capital (%) ............................................................................ 9.20% 7.59%
CRAR – Tier II capital (%) ........................................................................... 4.15% 4.19%
Amount of subordinated debt raised as Tier II capital during the year ..... 39,730.0 4,500.0
2. Business/information ratios
The business/information ratios for the year ended March 31, 2006, and March 31, 2005 are given in the table below.
Year ended Year ended
March 31, 2006 March 31, 2005
i) Interest income to working funds1.................................................... 7.03% 6.94%
ii) Non-interest income to working funds1............................................ 2.54% 2.52%
iii) Operating profit to working funds1.................................................... 2.39% 2.18%
iv) Return on assets2............................................................................... 1.30% 1.48%
v) Profit per employee (Rs. in million) ................................................... 1.0 1.1
1. For the purpose of computing the ratios, working funds represent the average of total assets as reported to RBI under
Section 27 of the Banking Regulation Act, 1949.
2. For the purpose of computing the ratio, assets represent average total assets as reported to RBI in Form X under Section
27 of the Banking Regulation Act, 1949.
Rupees in million
As on As on
March 31, 2006 March 31, 2005
vi) Business per employee ..................................................................... 90.5 88.0
(average deposits plus average advances)
3. Information about business and geographical segments
Consumer and Commercial Banking comprising the retail and corporate banking operations of the Bank.
Investment Banking comprising the treasury activities of the Bank.