ICICI Bank 2006 Annual Report Download - page 5
Download and view the complete annual report
Please find page 5 of the 2006 ICICI Bank annual report below. You can navigate through the pages in the report by either clicking on the pages listed below, or by using the keyword search tool below to find specific information within the annual report.-
 1
1 -
 2
2 -
 3
3 -
 4
4 -
 5
5 -
 6
6 -
 7
7 -
 8
8 -
 9
9 -
 10
10 -
 11
11 -
 12
12 -
 13
13 -
 14
14 -
 15
15 -
 16
16 -
17
-
18
-
19
-
20
-
21
-
22
-
23
-
24
-
25
-
26
-
27
-
28
-
29
-
30
-
31
-
32
-
33
-
34
-
35
-
36
-
37
-
38
-
39
-
40
-
41
-
42
-
43
-
44
-
45
-
46
-
47
-
48
-
49
-
50
-
51
-
52
-
53
-
54
-
55
-
56
-
57
-
58
-
59
-
60
-
61
-
62
-
63
-
64
-
65
-
66
-
67
-
68
-
69
-
70
-
71
-
72
-
73
-
74
-
75
-
76
-
77
-
78
-
79
-
80
-
81
-
82
-
83
-
84
-
85
-
86
-
87
-
88
-
89
-
90
-
91
-
92
-
93
-
94
-
95
-
96
-
97
-
98
-
99
-
100
-
101
-
102
-
103
-
104
-
105
-
106
-
107
-
108
-
109
-
110
-
111
-
112
-
113
-
114
-
115
-
116
-
117
-
118
-
119
-
120
-
121
-
122
-
123
-
124
-
125
-
126
-
127
-
128
-
129
-
130
-
131
-
132
-
133
-
134
-
135
-
136
-
137
 |
 |

4
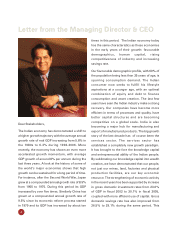
Letter from the Managing Director & CEO
Dear Stakeholders,
The Indian economy has demonstrated a shift to
a higher growth trajectory with the average annual
growth rate of real GDP increasing from 5.8% in
the 1980s to 6.3% during 1992-2006. More
recently, the economy has shown an even more
accelerated growth momentum, with average
GDP growth of around 8% per annum during the
last three years. A look at the history of some of
the world’s major economies shows that high
growth can be sustained for a long period of time.
For instance, after the Second World War, Japan
grew at a compounded annual growth rate of 8.5%
from 1955 to 1975. During this period its GDP
increased by over five times. Similarly China has
grown at a compounded annual growth rate of
9.5% since its economic reform process started
in 1979 and its GDP has increased by about ten
times in this period. The Indian economy today
has the same characteristics as these economies
in the early years of their growth: favourable
demographics, human capital, rising
competitiveness of industry and increasing
savings rate.
Our favourable demographic profile, with 69% of
the population being less than 35 years of age, is
spurring consumption demand. The Indian
consumer now seeks to fulfill his lifestyle
aspirations at a younger age, with an optimal
combination of equity and debt to finance
consumption and asset creation. The last few
years have seen the Indian industry make a strong
recovery. Our companies have become more
efficient in terms of processes and quality, have
better capital structures and are becoming
competitive on a global scale. India is also
becoming a major hub for manufacturing and
export of manufactured products. The big growth
story of the last decade has of course been the
services sector. The services sector has
established a completely new growth paradigm.
It has brought to the fore the knowledge capital
and entrepreneurial ability of the Indian people.
By sublimating our knowledge capital into wealth
creation, we have demonstrated that our people,
not just our mines, land, factories and physical
production facilities, are our key economic
resource. The strengthening of economic activity
in the recent years has been supported by increase
in gross domestic investment rates from 23.0%
of GDP in fiscal 2002 to 30.1% in fiscal 2005,
coupled with more efficient use of capital. Gross
domestic savings rate has also improved from
26.5% to 29.1% during the same period. This