ICICI Bank 2006 Annual Report Download - page 76
Download and view the complete annual report
Please find page 76 of the 2006 ICICI Bank annual report below. You can navigate through the pages in the report by either clicking on the pages listed below, or by using the keyword search tool below to find specific information within the annual report.-
 1
1 -
2
-
3
-
4
-
5
-
6
-
7
-
8
-
9
-
10
-
11
-
12
-
13
-
14
-
15
-
16
-
17
-
18
-
19
-
20
-
21
-
22
-
23
-
24
-
25
-
26
-
27
-
28
-
29
-
30
-
31
-
32
-
33
-
34
-
35
-
36
-
37
-
38
-
39
-
40
-
41
-
42
-
43
-
44
-
45
-
46
-
47
-
48
-
49
-
50
-
51
-
52
-
53
-
54
-
55
-
56
-
57
-
58
-
59
-
60
-
61
-
62
-
63
-
64
-
65
-
 66
66 -
 67
67 -
 68
68 -
 69
69 -
 70
70 -
 71
71 -
 72
72 -
 73
73 -
 74
74 -
 75
75 -
 76
76 -
 77
77 -
 78
78 -
 79
79 -
 80
80 -
 81
81 -
 82
82 -
 83
83 -
 84
84 -
 85
85 -
 86
86 -
87
-
88
-
89
-
90
-
91
-
92
-
93
-
94
-
95
-
96
-
97
-
98
-
99
-
100
-
101
-
102
-
103
-
104
-
105
-
106
-
107
-
108
-
109
-
110
-
111
-
112
-
113
-
114
-
115
-
116
-
117
-
118
-
119
-
120
-
121
-
122
-
123
-
124
-
125
-
126
-
127
-
128
-
129
-
130
-
131
-
132
-
133
-
134
-
135
-
136
-
137
 |
 |

F17
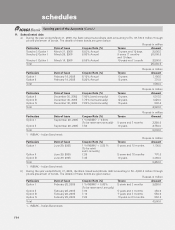
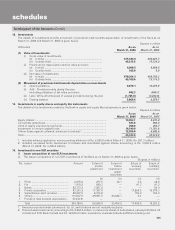
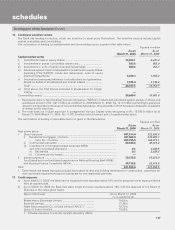
forming part of the Accounts (Contd.)
schedules
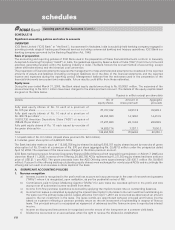
Inter-segment transactions are generally based on transfer pricing measures as determined by management. Income,
expenses, assets and liabilities are either specifically identified with individual segments or are allocated to segments on a
systematic basis.
Based on such allocations, segmental balance sheet as on March 31, 2006 and March 31, 2005 and segmental profit and
loss account for the year ended March 31, 2006 and for the year ended March 31, 2005 have been prepared.
Rupees in million
Consumer and Investment Total
commercial banking banking
Particulars For the For the For the For the For the For the
year ended year ended year ended year ended year ended year ended
31.03.06 31.03.05 31.03.06 31.03.05 31.03.06 31.03.05
1. Revenue .................................... 148,868.9 106,436.9 49,725.0 30,926.2 198,593.9 137,363.1
2. Less: Inter-segment revenue .... (10,917.6) (9,102.7)
3. Total revenue (1)–(2) .................. 187,676.3 128,260.4
4. Operating profit
(i.e. Profit before unallocated
expenses, and tax) .................... 33,870.5 19,760.7 13,420.2 10,183.3 47,290.7 29,944.0
5. Unallocated expenses .............. 384.0 384.0
6. Provisions (net) ......................... 7,320.2 814.1 8,620.5 3,473.9 15,940.7 4,288.0
7. Profit before tax ........................ 26,550.3 18,946.6 4,799.7 6,709.4 30,966.0 25,272.0
8. Income tax expenses
(net of deferred tax credit) ........ 5,565.3 5,220.0
9. Net profit (7)-(8) ......................... 25,400.7 20,052.0
10. Segment assets ........................ 1,643,838.9 1,051,486.3 839,301.3 597,045.1 2,483,140.2 1,648,531.4
11. Unallocated assets ................... 30,749.3 28,062.7
12. Total assets (10)+(11) ............... 2,513,889.5 1,676,594.1
13. Segment liabilities .................... 1,923,206.7 1,291,932.4 590,682.8 384,661.7 2,513,889.5 1,676,594.1
14. Unallocated liabilities ................ ——
15. Total liabilities (13)+(14) ............ 2,513,889.5 1,676,594.1
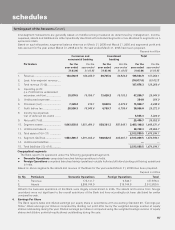
Geographical segments
The Bank reports its operations under the following geographical segments.
Domestic Operations comprises branches having operations in India.
Foreign Operations comprises branches having operations outside India and offshore banking unit having operations
in India.
Based on above segments the assets and revenue of the Bank for the year ended March 31, 2006 have been prepared.
Rupees in million
Sr. No Particulars Domestic Operations Foreign Operations Total
1. Revenue 178,131.7 9,544.7 187,676.4
2. Assets 2,295,744.9 218,144.6 2,513,889.5
Hitherto the business operations of the Bank were largely concentrated in India. The assets and income from foreign
operations were not significant to the overall operations of the Bank and have accordingly not been disclosed for earlier
comparative year.
4. Earnings Per Share
The Bank reports basic and diluted earnings per equity share in accordance with Accounting Standard 20, “Earnings per
Share”. Basic earnings per share is computed by dividing net profit after tax by the weighted average number of equity
shares outstanding during the year. Diluted earnings per share is computed using the weighted average number of equity
shares and dilutive potential equity shares outstanding during the year.