ICICI Bank 2006 Annual Report Download - page 63
Download and view the complete annual report
Please find page 63 of the 2006 ICICI Bank annual report below. You can navigate through the pages in the report by either clicking on the pages listed below, or by using the keyword search tool below to find specific information within the annual report.-
 1
1 -
2
-
3
-
4
-
5
-
6
-
7
-
8
-
9
-
10
-
11
-
12
-
13
-
14
-
15
-
16
-
17
-
18
-
19
-
20
-
21
-
22
-
23
-
24
-
25
-
26
-
27
-
28
-
29
-
30
-
31
-
32
-
33
-
34
-
35
-
36
-
37
-
38
-
39
-
40
-
41
-
42
-
43
-
44
-
45
-
46
-
47
-
48
-
49
-
50
-
51
-
52
-
 53
53 -
 54
54 -
 55
55 -
 56
56 -
 57
57 -
 58
58 -
 59
59 -
 60
60 -
 61
61 -
 62
62 -
 63
63 -
 64
64 -
 65
65 -
 66
66 -
 67
67 -
 68
68 -
 69
69 -
 70
70 -
 71
71 -
 72
72 -
 73
73 -
74
-
75
-
76
-
77
-
78
-
79
-
80
-
81
-
82
-
83
-
84
-
85
-
86
-
87
-
88
-
89
-
90
-
91
-
92
-
93
-
94
-
95
-
96
-
97
-
98
-
99
-
100
-
101
-
102
-
103
-
104
-
105
-
106
-
107
-
108
-
109
-
110
-
111
-
112
-
113
-
114
-
115
-
116
-
117
-
118
-
119
-
120
-
121
-
122
-
123
-
124
-
125
-
126
-
127
-
128
-
129
-
130
-
131
-
132
-
133
-
134
-
135
-
136
-
137
 |
 |

F4
Particulars Year ended Year ended
31.03.2006 31.03.2005
Cash flow from operating activities
Net profit before taxes ........................................................................... 30,966,076 25,272,032
Adjustments for:
Depreciation and amortisation .............................................................. 9,021,206 9,424,450
Net (appreciation)/depreciation on investments ................................... 8,301,403 5,416,494
Provision in respect of non-performing assets
(including prudential provision on standard assets) ............................. 7,947,244 (1,213,571)
Provision for contingencies & others ..................................................... 226,801 85,984
Dividend from subsidiaries .................................................................... (3,386,929) (1,880,786)
(Profit)/Loss on sale of fixed assets....................................................... (71,222) 20,822
53,004,579 37,125,425
Adjustments for:
(Increase)/decrease in investments ....................................................... (141,019,247) (43,133,937)
(Increase)/decrease in advances ........................................................... (552,112,941) (287,949,797)
Increase/(decrease) in borrowings ........................................................ 65,476,052 54,169,059
Increase/(decrease) in deposits ............................................................. 652,643,939 317,101,929
(Increase)/decrease in other assets....................................................... (36,704,232) (20,734,975)
Increase/(decrease) in other liabilities and provisions .......................... 13,861,469 43,226,853
2,145,040 62,679,132
Refund/(payment) of direct taxes .......................................................... (8,620,283) (8,487,388)
Net cash generated from operating activities ................................... (A) 46,529,336 91,317,169
Cash flow from investing activities
Investments in subsidiaries and/or joint ventures
(including application money) ................................................................ (8,509,194) (6,430,433)
Income received on such investments ................................................. 3,386,929 1,880,786
Purchase of fixed assets ........................................................................ (5,474,001) (3,795,277)
Proceeds from sale of fixed assets ....................................................... 942,843 262,914
(Purchase) / sale of held to maturity securities ..................................... (69,286,381) (26,370,435)
Net cash generated from investing activities .................................... (B) (78,939,804) (34,452,445)
Cash flow from financing activities
Proceeds from issue of share capital (other than ESOPs)
net of issue expenses ............................................................................ 79,039,409 31,922,933
Amount received on exercise of stock options .................................... 774,424 649,862
Net proceeds / (repayment) of bonds (including subordinated debt) .. 869,592 (38,616,923)
Dividend and dividend tax paid ............................................................. (7,174,390) (6,227,217)
Net cash generated from financing activities .................................... (C) 73,509,035 (12,271,345)
Effect of exchange fluctuation on translation reserve ...................... (D) 3,955 —
Net increase / (decrease) in cash and cash equivalents ................... (A) + (B) + (C) + (D) 41,102,522 44,593,379
Cash and cash equivalents at 1st April .............................................. 129,299,723 84,706,344
Cash and cash equivalents at 31st March.......................................... 170,402,245 129,299,723
For and on behalf of the Board of Directors
cash flow statement
for the year ended March 31, 2006
Significant accounting policies and notes to accounts (refer Schedule 18)
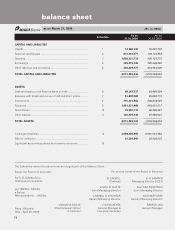
The Schedules referred to above form an integral part of the Balance Sheet.
As per our Report of even date
(Rs. in ‘000s)
N. VAGHUL
Chairman
LALITA D. GUPTE
Joint Managing Director
CHANDA D. KOCHHAR
Deputy Managing Director
JYOTIN MEHTA
General Manager &
Company Secretary
K. V. KAMATH
Managing Director & CEO
KALPANA MORPARIA
Joint Managing Director
NACHIKET MOR
Deputy Managing Director
RAKESH JHA
General Manager
VISHAKHA MULYE
Chief Financial Officer
& Treasurer
For S. R. Batliboi & Co.
Chartered Accountants
per VIREN H. MEHTA
a Partner
Membership No. : 048749
Place : Mumbai
Date : April 29, 2006