ICICI Bank 2006 Annual Report Download - page 53
Download and view the complete annual report
Please find page 53 of the 2006 ICICI Bank annual report below. You can navigate through the pages in the report by either clicking on the pages listed below, or by using the keyword search tool below to find specific information within the annual report.-
 1
1 -
2
-
3
-
4
-
5
-
6
-
7
-
8
-
9
-
10
-
11
-
12
-
13
-
14
-
15
-
16
-
17
-
18
-
19
-
20
-
21
-
22
-
23
-
24
-
25
-
26
-
27
-
28
-
29
-
30
-
31
-
32
-
33
-
34
-
35
-
36
-
37
-
38
-
39
-
40
-
41
-
42
-
 43
43 -
 44
44 -
 45
45 -
 46
46 -
 47
47 -
 48
48 -
 49
49 -
 50
50 -
 51
51 -
 52
52 -
 53
53 -
 54
54 -
 55
55 -
 56
56 -
 57
57 -
 58
58 -
 59
59 -
 60
60 -
 61
61 -
 62
62 -
 63
63 -
64
-
65
-
66
-
67
-
68
-
69
-
70
-
71
-
72
-
73
-
74
-
75
-
76
-
77
-
78
-
79
-
80
-
81
-
82
-
83
-
84
-
85
-
86
-
87
-
88
-
89
-
90
-
91
-
92
-
93
-
94
-
95
-
96
-
97
-
98
-
99
-
100
-
101
-
102
-
103
-
104
-
105
-
106
-
107
-
108
-
109
-
110
-
111
-
112
-
113
-
114
-
115
-
116
-
117
-
118
-
119
-
120
-
121
-
122
-
123
-
124
-
125
-
126
-
127
-
128
-
129
-
130
-
131
-
132
-
133
-
134
-
135
-
136
-
137
 |
 |

52
Management’s Discussion & Analysis
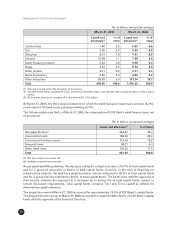
The following table sets forth, for the dates indicated, data regarding the non-performing assets.
Rs. in billion, except percentages
Gross Net Net % of Net NPA
NPA(1) NPA customer to customer
At assets assets
March 31, 2004 40.14 20.37 710.02 2.87
March 31, 2005 34.32 19.83 978.94 2.03
March 31, 2006 22.68 10.75 1,520.07 0.71
(1) Net of write-offs, interest suspense and claims received from ECGC/DICGC.
(2) All amounts have been rounded off to the nearest Rs. 10.0 million
The ratio of net non-performing assets to net customer assets decreased to 0.7% at March 31, 2006 from
2.0% at March 31, 2005. At March 31, 2006, the gross non-performing assets (net of write-offs) were
Rs. 22.68 billion compared to Rs. 34.32 billion at March 31, 2005. Gross of technical write-offs, the gross
non-performing loans at March 31, 2006 were Rs. 29.63 billion compared to Rs. 51.40 billion at March 31,
2005. The coverage ratio (i.e. total provisions and write-offs against non-performing assets as a percentage
of gross non-performing assets) at March 31, 2006 was 63.7%. The Bank’s investments in security receipts
issued by Asset Reconstruction Company (India) Limited, a reconstruction company registered with RBI,
were Rs. 21.22 billion at March 31, 2006.
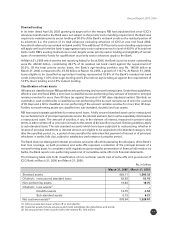
Classification of Non-Performing Loans by Industry
The following table sets forth the classification of gross non-performing loans (net of write-offs) by industry
sector at March 31, 2005 and March 31, 2006.
Rs. billion, except percentages
March 31, 2005 March 31, 2006
Amount % of total Amount % of total
Chemicals 4.03 11.6 1.99 8.7
Textiles 3.24 9.4 1.26 5.5
Services – Others 0.67 1.9 0.80 3.5
Agriculture 0.27 0.8 0.80 3.5
Automobile (including trucks) 0.68 2.0 0.74 3.2
Electronics 1.41 4.1 0.39 1.7
Food processing 0.72 2.1 0.34 1.5
Iron & steel 0.67 1.9 0.19 0.8
Engineering 1.42 4.1 0.14 0.6
Ceramics, granites & related 0.25 0.7 0.13 0.6
Paper & paper products 0.35 1.0 0.05 0.2
Other metal & metal products 0.38 1.1 0.04 0.2
Rubber & rubber products 0.33 0.9 0.03 0.1
Services – Finance 0.77 2.2 0.01 0.0
Power 7.37 21.3 0.00 0.0
Cement 0.20 0.6 0.00 0.0
Other Infrastructure – Telecom 2.14 6.2 0.00 0.0
Miscellaneous & others(1) 9.70 28.1 16.04 69.9
Total of above 34.60 100.0 22.95 100.0
Less: Interest suspense & claims received from ECGC/ DICGC 0.28 0.27
Gross non-performing loans (net of write-offs) 34.32 22.68
(1) Net non-performing assets in the retail portfolio at March 31, 2006 were 0.77% of net retail loans.
(2) All amounts have been rounded off to the nearest Rs. 10.0 million.