ICICI Bank 2006 Annual Report Download - page 85
Download and view the complete annual report
Please find page 85 of the 2006 ICICI Bank annual report below. You can navigate through the pages in the report by either clicking on the pages listed below, or by using the keyword search tool below to find specific information within the annual report.-
 1
1 -
2
-
3
-
4
-
5
-
6
-
7
-
8
-
9
-
10
-
11
-
12
-
13
-
14
-
15
-
16
-
17
-
18
-
19
-
20
-
21
-
22
-
23
-
24
-
25
-
26
-
27
-
28
-
29
-
30
-
31
-
32
-
33
-
34
-
35
-
36
-
37
-
38
-
39
-
40
-
41
-
42
-
43
-
44
-
45
-
46
-
47
-
48
-
49
-
50
-
51
-
52
-
53
-
54
-
55
-
56
-
57
-
58
-
59
-
60
-
61
-
62
-
63
-
64
-
65
-
66
-
67
-
68
-
69
-
70
-
71
-
72
-
73
-
74
-
 75
75 -
 76
76 -
 77
77 -
 78
78 -
 79
79 -
 80
80 -
 81
81 -
 82
82 -
 83
83 -
 84
84 -
 85
85 -
 86
86 -
 87
87 -
 88
88 -
 89
89 -
 90
90 -
 91
91 -
 92
92 -
 93
93 -
 94
94 -
 95
95 -
96
-
97
-
98
-
99
-
100
-
101
-
102
-
103
-
104
-
105
-
106
-
107
-
108
-
109
-
110
-
111
-
112
-
113
-
114
-
115
-
116
-
117
-
118
-
119
-
120
-
121
-
122
-
123
-
124
-
125
-
126
-
127
-
128
-
129
-
130
-
131
-
132
-
133
-
134
-
135
-
136
-
137
 |
 |

F26
schedules
forming part of the Accounts (Contd.)
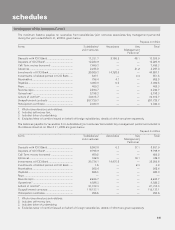
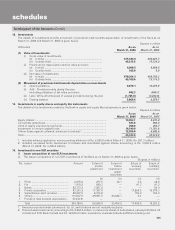
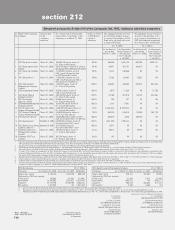
b) The issuer composition of non-SLR investments of the Bank as on March 31, 2005 is given below.
Rupees in million
No. Issuer Amount Extent of Extent of Extent of Extent of
private ‘below ‘unrated’ ‘unlisted’
placement investment securities2securities2
grade’
securities
(a) (b) (c) (d)
1. PSUs ................................................... 6,250.0 4,620.5 — 20.5 2,933.6
2. FIs .................................................... 3,264.3 342.3 — 101.3 101.3
3. Banks .................................................. 4,684.5 2,419.8 — — 53.1
4. Private corporates............................... 45,210.9 30,553.2 200.0 31,362.1 29,677.4
5. Subsidiaries/ Joint ventures ............... 20,667.0 2,661.3 — 150.0 150.0
6. Others ................................................. 86,856.4 27,821.3 23,359.0 0.3 —
7. Provision held towards depreciation .. (6,877.5) — — — —
Total 160,055.6 68,418.4 23,559.0 31,634.2 32,915.4
1. Amounts reported under columns (a), (b), (c), and (d) above are not mutually exclusive.
2. This excludes investments, amounting to Rs. 2,551.3 million, in preference shares of subsidiaries, namely ICICI Bank UK
Limited and ICICI Bank Canada and Rs. 7,189.6 million invested by overseas branches / offshore banking unit.
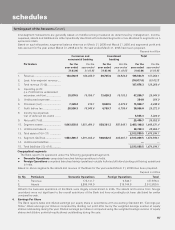
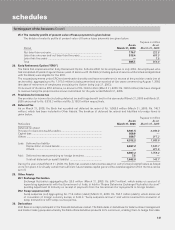
ii) Non-performing non-SLR investments
The movement in gross non-performing non-SLR investments of the Bank as on March 31, 2006, and March 31, 2005
are given below.
Rupees in million
Particulars Year ended Year ended
March 31, 2006 March 31, 2005
Opening balance ................................................................................ 8,877.3 12,334.7
Additions during the year .................................................................. 2,158.0 1,570.3
Reduction during the year ................................................................. 8,439.4 5,027.3
Closing balance ................................................................................. 2,595.9 8,877.3
Total provisions held .......................................................................... 1,509.3 3,166.7
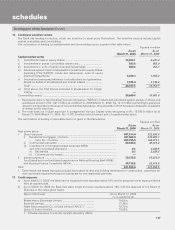
15. Repurchase transactions
The details of securities sold and purchased under repos and reverse repos during the year ended March 31, 2006, and
March 31, 2005 are given below.
Rupees in million
Minimum Maximum Daily Balance
outstanding outstanding average as on
balance balance outstanding year end
during the during the balance
period period during the
period
Year ended March 31, 2006
Securities sold under repurchase transaction — 43,134.3 15,296.0 10,000.0
Securities purchased under reverse repurchase transaction — 33,608.7 1,214.9 —
Year ended March 31, 2005
Securities sold under repurchase transaction — 34,842.0 9,683.6 13,076.3
Securities purchased under reverse repurchase transaction — 14,520.0 586.7 —
Note: The above figures do not include securities sold and purchased under Liquidity Adjustment Facility (‘’LAF”) of RBI. The above figures
are for Indian branches only.