ICICI Bank 2006 Annual Report Download - page 125
Download and view the complete annual report
Please find page 125 of the 2006 ICICI Bank annual report below. You can navigate through the pages in the report by either clicking on the pages listed below, or by using the keyword search tool below to find specific information within the annual report.-
 1
1 -
2
-
3
-
4
-
5
-
6
-
7
-
8
-
9
-
10
-
11
-
12
-
13
-
14
-
15
-
16
-
17
-
18
-
19
-
20
-
21
-
22
-
23
-
24
-
25
-
26
-
27
-
28
-
29
-
30
-
31
-
32
-
33
-
34
-
35
-
36
-
37
-
38
-
39
-
40
-
41
-
42
-
43
-
44
-
45
-
46
-
47
-
48
-
49
-
50
-
51
-
52
-
53
-
54
-
55
-
56
-
57
-
58
-
59
-
60
-
61
-
62
-
63
-
64
-
65
-
66
-
67
-
68
-
69
-
70
-
71
-
72
-
73
-
74
-
75
-
76
-
77
-
78
-
79
-
80
-
81
-
82
-
83
-
84
-
85
-
86
-
87
-
88
-
89
-
90
-
91
-
92
-
93
-
94
-
95
-
96
-
97
-
98
-
99
-
100
-
101
-
102
-
103
-
104
-
105
-
106
-
107
-
108
-
109
-
110
-
111
-
112
-
113
-
114
-
 115
115 -
 116
116 -
 117
117 -
 118
118 -
 119
119 -
 120
120 -
 121
121 -
 122
122 -
 123
123 -
 124
124 -
 125
125 -
 126
126 -
 127
127 -
 128
128 -
 129
129 -
 130
130 -
 131
131 -
 132
132 -
 133
133 -
 134
134 -
 135
135 -
136
-
137
 |
 |

F66
schedules
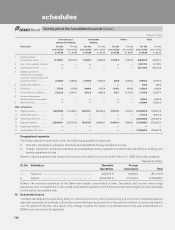
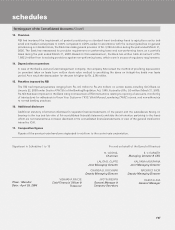
forming part of the Consolidated Accounts (Contd.)
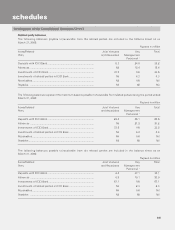
Geographical segments
The Group reports its operations under the following geographical segments.
a. Domestic Operations comprises branches and subsidiaries having operations in India.
b. Foreign Operations comprises branches and subsidiaries having operations outside India and offshore banking unit
having operations in India.
Based on above segments the assets and revenue of the Bank for the year ended March 31, 2006 have been prepared.
Rupees in million
Sr. No. Particulars Domestic Foreign
Operations Operations Total
1. Revenue ..................................................................... 243,570.9 14,040.0 257,610.9
2. Assets ........................................................................ 2,436,465.6 333,394.4 2,769,860.0
Hitherto the business operations of the Bank were largely concentrated in India. The assets and income from foreign
operations were not significant to the overall consolidated operations of the Bank and have accordingly not been disclosed
for the earlier comparative year.
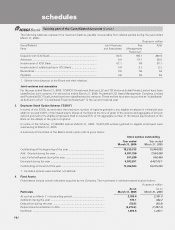
12. Subvention income
The Bank has aligned its accounting policy for subvention income with its accounting policy for direct marketing agency/
associate expenses. Accordingly, subvention income has been accounted for in the period in which it is received instead of
over the period of the loan. As a result of the change in policy, the impact on profit after tax for the year ended March 31,
2006 is not expected to be significant.
Rupees in million
Consumer and Investment Others Total
commercial banking banking
Particulars For the For the For the For the For the For the For the For the
year ended year ended year ended year ended year ended year ended year ended year ended
31.03.06 31.03.05 31.03.06 31.03.05 31.03.06 31.03.05 31.03.06 31.03.05
1 Revenue (before
extraordinary profit) .............. 151,950.1 108,779.9 53,425.6 32,599.2 63,152.8 37,037.6 268,528.5 178,416.7
2 Less: Inter- segment revenue ——————(10,917.6) (9,102.8)
3 Total revenue (1) -(2) .............. ——————257,610.9 169,313.9
4 Operating profit (i.e.
Profit before unallocated
expenses, extraordinary profit,
provision and tax) .................. 33,404.2 19,965.0 14,156.9 10,439.3 288.0 (1,606.8) 47,849.2 28,797.5
5 Unallocated expenses .......... ——————384.0 384.0
6 Provisions .............................. 7,532.2 1,150.9 8,944.9 3,478.4 (210.7) (422.9) 16,266.4 4,206.4
7 Profit before tax (4)-(5)-(6) ..... 25,872.0 18,814.1 5,212.0 6,960.9 498.7 (1,183.9) 31,198.8 24,207.1
8 Income tax expenses
(net)/(net deferred tax credit) ——————6,998.0 5,683.8
9 Net Profit (7)-(8) ..................... ——————24,200.8 18,523.3
Other Information
10 Segment assets ................... 1,802,556.0 1,118,447.3 824,793.1 588,286.8 110,734.9 47,778.4 2,738,084.0 1,754,512.5
11 Unallocated assets ............... ——————31,776.0 28,915.3
12 Total assets (10)+(11) ........... ——————2,769,860.0 1,783,427.8
13 Segment liabilities ................. 2,080,899.1 1,353,714.3 584,579.5 389,689.1 104,381.4 40,024.4 2,769,860.0 1,783,427.8
14 Unallocated liabilities ........... ————————
15 Total liabilities (13)+(14) ....... ——————2,769,860.0 1,783,427.8