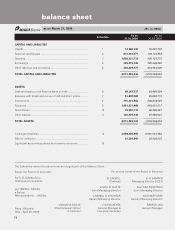
ICICI Bank 2006 Annual Report Download - page 51
Download and view the complete annual report
Please find page 51 of the 2006 ICICI Bank annual report below. You can navigate through the pages in the report by either clicking on the pages listed below, or by using the keyword search tool below to find specific information within the annual report.-
 1
1 -
2
-
3
-
4
-
5
-
6
-
7
-
8
-
9
-
10
-
11
-
12
-
13
-
14
-
15
-
16
-
17
-
18
-
19
-
20
-
21
-
22
-
23
-
24
-
25
-
26
-
27
-
28
-
29
-
30
-
31
-
32
-
33
-
34
-
35
-
36
-
37
-
38
-
39
-
40
-
 41
41 -
 42
42 -
 43
43 -
 44
44 -
 45
45 -
 46
46 -
 47
47 -
 48
48 -
 49
49 -
 50
50 -
 51
51 -
 52
52 -
 53
53 -
 54
54 -
 55
55 -
 56
56 -
 57
57 -
 58
58 -
 59
59 -
 60
60 -
 61
61 -
62
-
63
-
64
-
65
-
66
-
67
-
68
-
69
-
70
-
71
-
72
-
73
-
74
-
75
-
76
-
77
-
78
-
79
-
80
-
81
-
82
-
83
-
84
-
85
-
86
-
87
-
88
-
89
-
90
-
91
-
92
-
93
-
94
-
95
-
96
-
97
-
98
-
99
-
100
-
101
-
102
-
103
-
104
-
105
-
106
-
107
-
108
-
109
-
110
-
111
-
112
-
113
-
114
-
115
-
116
-
117
-
118
-
119
-
120
-
121
-
122
-
123
-
124
-
125
-
126
-
127
-
128
-
129
-
130
-
131
-
132
-
133
-
134
-
135
-
136
-
137
 |
 |

50
Management’s Discussion & Analysis
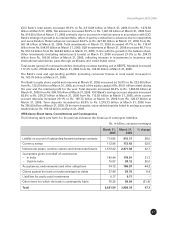
Rs. in billion, except percentages
March 31, 2005 March 31, 2006
Loand and % of Loans and % of
advances(1) total advances(1) total
Construction 1.46 0.2 8.93 0.6
Tea 2.05 0.2 8.03 0.5
Shipping 8.73 1.0 7.47 0.5
Cement 10.08 1.1 7.09 0.5
Paper & paper products 5.43 0.6 6.40 0.4
Sugar 4.54 0.5 5.92 0.4
Other textiles 4.21 0.5 4.11 0.3
Gems & jewellery 2.66 0.3 2.56 0.2
Other industries 65.50 6.9 151.34 10.3
Total 930.45 100.0 1,476.25 100.0
(1) Amount is net of write-offs and gross of provisions.
(2) Includes home loans, automobile loans, commercial business loans, two-wheeler loans, personal loans, credit cards &
others.
(3) All amounts have been rounded off to the nearest Rs. 10.0 million.
At March 31, 2006, the three largest industries to which the Bank had given loans were services (5.2%),
iron & steel (3.1%) and crude petroleum/refining (2.7%).
The following table sets forth, at March 31, 2006, the composition of ICICI Bank’s retail finance loans, net
of provisions.
Rs. in billion, except percentages
Loans and advances(1) % of total
Mortgage finance(2) 454.07 49.3
Automobile loans 188.24 20.4
Commercial business loans 112.16 12.2
Personal loans 58.21 6.3
Other retail loans 109.30 11.9
Total 921.98 100.0
(1) Net of provisions and write off.
(2) Includes commercial real estate.
As per applicable RBI guidelines, the exposure ceiling for a single borrower is 15.0% of total capital funds
and for a group of borrowers is 40.0% of total capital funds. However, in the case of financing for
infrastructure projects, the limit for a single borrower may be extended to 20.0% of total capital funds
and for a group may be extended to 50.0% of total capital funds. The banks may, with the approval of
their boards, enhance the exposure to a borrower up to further 5% of total capital funds, subject to
certain disclosure requirements. Total capital funds comprise Tier-I and Tier-II capital as defined for
determining capital adequacy.
The largest borrower at March 31, 2006 accounted for approximately 13.0% of ICICI Bank’s capital funds.
The largest borrower group at March 31, 2006 accounted for approximately 22.2% of ICICI Bank’s capital
funds with the approval of the Board of Directors.