ICICI Bank 2006 Annual Report Download - page 44
Download and view the complete annual report
Please find page 44 of the 2006 ICICI Bank annual report below. You can navigate through the pages in the report by either clicking on the pages listed below, or by using the keyword search tool below to find specific information within the annual report.-
 1
1 -
2
-
3
-
4
-
5
-
6
-
7
-
8
-
9
-
10
-
11
-
12
-
13
-
14
-
15
-
16
-
17
-
18
-
19
-
20
-
21
-
22
-
23
-
24
-
25
-
26
-
27
-
28
-
29
-
30
-
31
-
32
-
33
-
 34
34 -
 35
35 -
 36
36 -
 37
37 -
 38
38 -
 39
39 -
 40
40 -
 41
41 -
 42
42 -
 43
43 -
 44
44 -
 45
45 -
 46
46 -
 47
47 -
 48
48 -
 49
49 -
 50
50 -
 51
51 -
 52
52 -
 53
53 -
 54
54 -
55
-
56
-
57
-
58
-
59
-
60
-
61
-
62
-
63
-
64
-
65
-
66
-
67
-
68
-
69
-
70
-
71
-
72
-
73
-
74
-
75
-
76
-
77
-
78
-
79
-
80
-
81
-
82
-
83
-
84
-
85
-
86
-
87
-
88
-
89
-
90
-
91
-
92
-
93
-
94
-
95
-
96
-
97
-
98
-
99
-
100
-
101
-
102
-
103
-
104
-
105
-
106
-
107
-
108
-
109
-
110
-
111
-
112
-
113
-
114
-
115
-
116
-
117
-
118
-
119
-
120
-
121
-
122
-
123
-
124
-
125
-
126
-
127
-
128
-
129
-
130
-
131
-
132
-
133
-
134
-
135
-
136
-
137
 |
 |

43
Annual Report 2005-2006
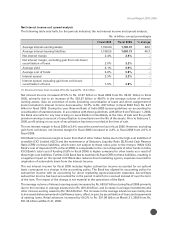
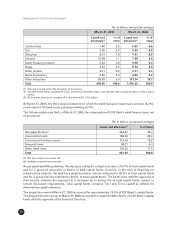
Net interest income and spread analysis
The following table sets forth, for the periods indicated, the net interest income and spread analysis.
Rs. in billion, except percentages
Fiscal 2005 Fiscal 2006 % change
Average interest-earning assets 1,153.24 1,706.81 48.0
Average interest-bearing liabilities 1,138.25 1,658.73 45.7
Net interest margin 2.4% 2.4% –
Net interest margin, excluding gain from sell-down/
securitisation of loans 2.0% 2.2% –
Average yield 8.1% 8.0% –
Average cost of funds 5.8% 5.8% –
Interest spread 2.3% 2.2% –
Interest spread, excluding gain from sell-down/
securitisation of loans 1.9% 2.0% –
(1) All amounts have been rounded off to the nearest Rs. 10.0 million.
Net interest income increased 47.5% to Rs. 41.87 billion in fiscal 2006 from Rs. 28.39billion in fiscal
2005, primarily due to an increase of Rs. 553.57 billion or 48.0% in the average volume of interest-
earning assets. Gain on sell-down of loans (including securitisation of loans and direct assignment of
loans) included in interest income decreased by 12.3% to Rs. 4.57 billion in fiscal 2006 from Rs. 5.21
billion in fiscal 2005. During the year, Reserve Bank of India (RBI) issued guidelines on accounting for
securitisation of standard assets. In accordance with these guidelines, with effect from February 1, 2006,
the Bank accounts for any loss arising on securitisation immediately at the time of sale and the profit/
premium arising on account of securitisation is amortised over the life of the assets. Prior to February 1,
2006, profit arising on account of securitisation has been recorded at the time of sale.
The net interest margin in fiscal 2006 at 2.4% was at the same level as in fiscal 2005. However, excluding
gain from sell-down, net interest margin for fiscal 2006 increased to 2.2% in fiscal 2006 from 2.0% in
fiscal 2005.
ICICI Bank’s net interest margin is lower than that of other Indian banks due to the high-cost liabilities of
erstwhile ICICI Limited (ICICI) and the maintenance of Statutory Liquidity Ratio (SLR) and Cash Reserve
Ratio (CRR) on these liabilities, which were not subject to these ratios prior to the merger. While ICICI
Bank’s cost of deposits (5.0% in fiscal 2006) is comparable to the cost of deposits of other banks in India,
ICICI Bank’s total cost of funding (5.8% in fiscal 2006) is higher compared to other banks as a result of
these high-cost liabilities. Further, ICICI Bank has to maintain SLR and CRR on these liabilities, resulting in
a negative impact on the spread. ICICI Bank also reduces direct marketing agency expenses incurred for
origination of automobile loans from the interest income.
The net interest income for fiscal 2006 includes higher subvention income accounted for on upfront
basis consequent to a change in the accounting policy. The Bank has aligned its accounting policy for
subvention income with its accounting for direct marketing agency/associate expenses. Accordingly
subvention income has been accounted for in the period in which it is received instead of over the term
of the loan. The impact of the change is not material to the operations of the Bank.
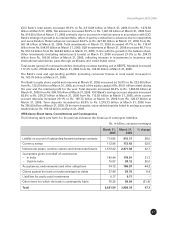
The average volume of interest-earning assets increased by Rs. 553.57 billion during fiscal 2006 primarily
due to the increase in average advances by Rs. 400.33 billion, and increase in average investments and
other interest-earning assets by Rs.153.24 billion. The increase in the average advances was mainly due
to increased disbursements of retail finance loans, offset, in part, by securitisation of loans and repayments
of existing loans. Retail advances increased by 64.2% to Rs. 921.98 billion at March 31, 2006 from Rs.
561.34 billion at March 31, 2005.