ICICI Bank 2006 Annual Report Download - page 45
Download and view the complete annual report
Please find page 45 of the 2006 ICICI Bank annual report below. You can navigate through the pages in the report by either clicking on the pages listed below, or by using the keyword search tool below to find specific information within the annual report.-
 1
1 -
2
-
3
-
4
-
5
-
6
-
7
-
8
-
9
-
10
-
11
-
12
-
13
-
14
-
15
-
16
-
17
-
18
-
19
-
20
-
21
-
22
-
23
-
24
-
25
-
26
-
27
-
28
-
29
-
30
-
31
-
32
-
33
-
34
-
 35
35 -
 36
36 -
 37
37 -
 38
38 -
 39
39 -
 40
40 -
 41
41 -
 42
42 -
 43
43 -
 44
44 -
 45
45 -
 46
46 -
 47
47 -
 48
48 -
 49
49 -
 50
50 -
 51
51 -
 52
52 -
 53
53 -
 54
54 -
 55
55 -
56
-
57
-
58
-
59
-
60
-
61
-
62
-
63
-
64
-
65
-
66
-
67
-
68
-
69
-
70
-
71
-
72
-
73
-
74
-
75
-
76
-
77
-
78
-
79
-
80
-
81
-
82
-
83
-
84
-
85
-
86
-
87
-
88
-
89
-
90
-
91
-
92
-
93
-
94
-
95
-
96
-
97
-
98
-
99
-
100
-
101
-
102
-
103
-
104
-
105
-
106
-
107
-
108
-
109
-
110
-
111
-
112
-
113
-
114
-
115
-
116
-
117
-
118
-
119
-
120
-
121
-
122
-
123
-
124
-
125
-
126
-
127
-
128
-
129
-
130
-
131
-
132
-
133
-
134
-
135
-
136
-
137
 |
 |

44
Management’s Discussion & Analysis
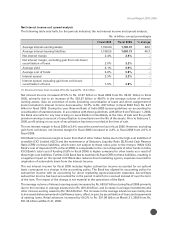
Total interest income increased 46.5% to Rs. 137.84billion in fiscal 2006 from Rs. 94.10 billion in fiscal
2005 primarily due to an increase of 48.0% in the average interest-earning assets to Rs.1,706.81billion,
offset, in part, by a decline in yield on interest-earning assets to 8.0% in fiscal 2006 from 8.1% in fiscal
2005. The decline in yield was primarily due to lower level of sell-down gains in fiscal 2006 compared to
fiscal 2005, offset by an increase in the yield on investments. While the yield on average advances declined
by 0.8% to 8.6% in fiscal 2006, the yield on average investments increased by 1.2% to 7.6% in fiscal
2006.
Total interest expense increased 46.1% to Rs. 95.97 billion in fiscal 2006 from Rs.65.71 billion in fiscal
2005, due to a 45.7% increase in average interest-bearing liabilities to Rs. 1,658.73billion. Cost of funds
for fiscal year 2006 remained at 5.8%. Cost of deposits increased to 5.0% in fiscal 2006 from 4.5% in
fiscal 2005 consequent to the general increase in interest rates in India, in particular the increase in
short-term interest rates in the second half of fiscal 2006. Deposits increased 65.4% to 1,650.83 billion at
March 31, 2006, constituting 77.2% of the Bank’s total funding (comprising deposits, borrowings and
subordinated debt) compared to 70.5% at March 31, 2005.
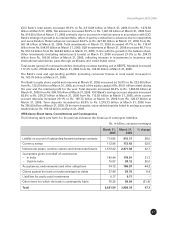
Fee income
Fee income increased by 55.3% to Rs. 32.59 billion in fiscal 2006 from Rs. 20.98 billion in fiscal 2005
primarily due to growth in credit card fees and third-party product distribution fees, increase in income
from remittances and other fees from international banking business and growth in corporate banking
fees. During fiscal 2006, retail products and services contributed about 58% of total fee income, corporate
products and services contributed about 30% and international products and services contributed the
balance 12%. Fee income includes merchant foreign exchange income amounting to Rs. 2.55 billion in
fiscal 2006 and Rs. 1.77 billion in fiscal 2005.
Treasury income
Total income from treasury-related activities increased 30.5% to Rs. 9.28 billion in fiscal 2006 from
Rs. 7.11 billion in fiscal 2005 primarily due to increase in the profit on sale of equity investments. Capital
gains on shares were Rs. 6.77 billion for fiscal 2006 compared to Rs. 4.61 billion for fiscal 2005, as ICICI
Bank continued to capitalise on the opportunities created by the buoyant equity markets through divestment
of certain of its non-core investments and through proprietary trading positions. Treasury income also
includes income from derivatives reflecting primarily the transactions undertaken with customers by the
Bank.
Lease & other income
Lease income decreased by 10.0% to Rs. 3.61 billion in fiscal 2006 from Rs. 4.01 billion in fiscal 2005
mainly due to a reduction in lease assets since ICICI Bank is not entering into new lease transactions. ICICI
Bank’s total lease assets were Rs. 11.74 billion at March 31, 2006 compared to Rs. 14.53 billion at
March 31, 2005. Other income increased 111.2% to Rs. 4.35 billion for fiscal 2006 compared to Rs. 2.06
billion for fiscal 2005 primarily due to increase in dividend from subsidiaries and gains from buyback of
shares by subsidiaries.
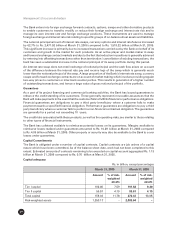
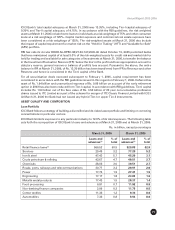
Non-interest expense
The following table sets forth, for the periods indicated, the principal components of non-interest expense.
Rs. in billion, except percentages
Fiscal 2005 Fiscal 2006 % change
Employee expenses 7.37 10.82 46.8
Depreciation on fixed assets other than leased assets 2.93 3.47 18.4
Rent, taxes & lighting 1.85 2.35 27.0
Printing & stationery 0.88 1.11 26.1
Postage & courier 1.74 2.16 24.1
Repairs, telephone & maintenance 2.16 2.58 19.4
Insurance 0.60 1.08 80.0