ICICI Bank 2006 Annual Report Download - page 87
Download and view the complete annual report
Please find page 87 of the 2006 ICICI Bank annual report below. You can navigate through the pages in the report by either clicking on the pages listed below, or by using the keyword search tool below to find specific information within the annual report.-
 1
1 -
2
-
3
-
4
-
5
-
6
-
7
-
8
-
9
-
10
-
11
-
12
-
13
-
14
-
15
-
16
-
17
-
18
-
19
-
20
-
21
-
22
-
23
-
24
-
25
-
26
-
27
-
28
-
29
-
30
-
31
-
32
-
33
-
34
-
35
-
36
-
37
-
38
-
39
-
40
-
41
-
42
-
43
-
44
-
45
-
46
-
47
-
48
-
49
-
50
-
51
-
52
-
53
-
54
-
55
-
56
-
57
-
58
-
59
-
60
-
61
-
62
-
63
-
64
-
65
-
66
-
67
-
68
-
69
-
70
-
71
-
72
-
73
-
74
-
75
-
76
-
 77
77 -
 78
78 -
 79
79 -
 80
80 -
 81
81 -
 82
82 -
 83
83 -
 84
84 -
 85
85 -
 86
86 -
 87
87 -
 88
88 -
 89
89 -
 90
90 -
 91
91 -
 92
92 -
 93
93 -
 94
94 -
 95
95 -
 96
96 -
 97
97 -
98
-
99
-
100
-
101
-
102
-
103
-
104
-
105
-
106
-
107
-
108
-
109
-
110
-
111
-
112
-
113
-
114
-
115
-
116
-
117
-
118
-
119
-
120
-
121
-
122
-
123
-
124
-
125
-
126
-
127
-
128
-
129
-
130
-
131
-
132
-
133
-
134
-
135
-
136
-
137
 |
 |

F28
forming part of the Accounts (Contd.)
schedules
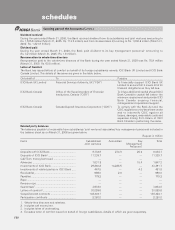
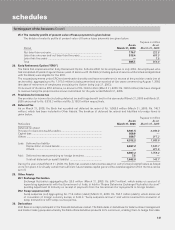
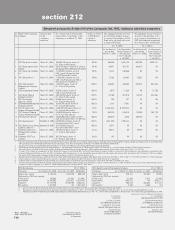
18. Risk category-wise country-wise exposure
As per the extant RBI guidelines, the country exposure of the Bank is categorised into various risk categories listed in the
following table. The country exposure (net) of the Bank in respect of United Kingdom is 1.11% of the total funded assets. As
the net funded exposure to United Kingdom exceeds 1%, the Bank has made a provision of Rs. 63.6 million on country
exposure during the year ended March 31, 2006.
Rupees in million
Risk category Exposure (net) Exposure (net)
as on as on
March 31, 2006 March 31, 2005
Insignificant ............................................................................................... 118,755.5 54,349.8
Low ............................................................................................................ 44,689.4 11,408.4
Moderate ................................................................................................... 24,372.9 4,592.1
High............................................................................................................ 3,357.7 —
Very High.................................................................................................... ——
Restricted................................................................................................... 447.1 —
Off-Credit ................................................................................................... 223.1 656.2
Total............................................................................................................ 191,845.7 71,006.5
- of which funded ....................................................................................... 138,915.0 38,885.7
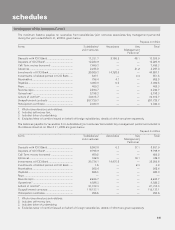
19. Advances
The details of movement of gross NPAs, net NPAs and provisions are given in the table below.
Rupees in million
Particulars Year ended Year ended
March 31, 2006 March 31, 2005
(i) Net NPAs (funded) to Net Advances (%) ........................................... 0.72% +1.65%
(ii) Movement of NPAs (Gross)
(a) Opening balance ........................................................................ 27,704.3 30,475.9
(b) Additions during the year1......................................................... 10,202.3 11,157.9
(c) Reductions during the year1...................................................... (15,680.7) (13,929.5)
(d) Closing balance 2....................................................................... 22,225.9 27,704.3
(iii) Movement of Net NPAs
(a) Opening balance ........................................................................ 15,052.7 13,724.0
(b) Additions during the year1......................................................... 7,035.0 11,216.3
(c) Reductions during the year1...................................................... (11,560.9) (9,887.6)
(d) Closing balance ......................................................................... 10,526.8 15,052.7
(iv) Movement of provisions for NPAs
(excluding provisions on standard assets)
(a) Opening balance 3.................................................................... 12,368.5 16,250.14
(b) Provisions made during the year
(including utilisation of fair value provisions) ............................ 5,601.2 18,002.1
(c) Write-off/write-back of excess provisions ................................. (6,542.2) (21,883.7)
(d) Closing balance 3....................................................................... 11,427.5 12,368.5
1. Excludes cases added to and deleted from NPAs in the same year with such gross loans amounting to Rs. 1,714.7
million (March 31, 2005: Rs. 13,759.9 million) and such net loans amounting to Rs. 1,463.2 million (March 31, 2005:
Rs. 9,540.7 million).
2. Includes suspended interest and claims received from ECGC/DICGC of Rs. 271.6 million (March 31, 2005: Rs. 283.7
million) on working capital loan.
3. Excludes technical write-off amounting to Rs. 6,586.7 million (March 31, 2005: Rs. 15,763.6 million) and suspended
interest and claims received from ECGC/DICGC of Rs. 271.6 million (March 31, 2005: Rs. 283.7 million).
4. Includes utilisation of fair value provisions.