ICICI Bank 2006 Annual Report Download - page 48
Download and view the complete annual report
Please find page 48 of the 2006 ICICI Bank annual report below. You can navigate through the pages in the report by either clicking on the pages listed below, or by using the keyword search tool below to find specific information within the annual report.-
 1
1 -
2
-
3
-
4
-
5
-
6
-
7
-
8
-
9
-
10
-
11
-
12
-
13
-
14
-
15
-
16
-
17
-
18
-
19
-
20
-
21
-
22
-
23
-
24
-
25
-
26
-
27
-
28
-
29
-
30
-
31
-
32
-
33
-
34
-
35
-
36
-
37
-
 38
38 -
 39
39 -
 40
40 -
 41
41 -
 42
42 -
 43
43 -
 44
44 -
 45
45 -
 46
46 -
 47
47 -
 48
48 -
 49
49 -
 50
50 -
 51
51 -
 52
52 -
 53
53 -
 54
54 -
 55
55 -
 56
56 -
 57
57 -
 58
58 -
59
-
60
-
61
-
62
-
63
-
64
-
65
-
66
-
67
-
68
-
69
-
70
-
71
-
72
-
73
-
74
-
75
-
76
-
77
-
78
-
79
-
80
-
81
-
82
-
83
-
84
-
85
-
86
-
87
-
88
-
89
-
90
-
91
-
92
-
93
-
94
-
95
-
96
-
97
-
98
-
99
-
100
-
101
-
102
-
103
-
104
-
105
-
106
-
107
-
108
-
109
-
110
-
111
-
112
-
113
-
114
-
115
-
116
-
117
-
118
-
119
-
120
-
121
-
122
-
123
-
124
-
125
-
126
-
127
-
128
-
129
-
130
-
131
-
132
-
133
-
134
-
135
-
136
-
137
 |
 |

47
Annual Report 2005-2006
ICICI Bank’s total assets increased 49.9% to Rs. 2,513.89 billion at March 31, 2006 from Rs. 1,676.59
billion at March 31, 2005. Net advances increased 59.9% to Rs. 1,461.63 billion at March 31, 2006 from
Rs. 914.05 billion at March 31, 2005 primarily due to increase in retail advances in accordance with ICICI
Bank’s strategy of growth in its retail portfolio, offset, in part by a reduction in advances due to repayments
and securitisation. Retail advances increased 64.2% to Rs. 921.98 billion at March 31, 2006 from Rs.
561.34 billion at March 31, 2005. Total investments at March 31, 2005 increased 41.7% to Rs. 715.47
billion from Rs. 504.87 billion at March 31, 2005. SLR investments at March 31, 2006 increased 48.1% to
Rs. 510.74 billion from Rs. 344.82 billion at March 31, 2005, in line with the growth in the balance sheet.
Other investments (including debentures & bonds) at March 31, 2006 increased 27.9% to Rs. 204.73
billion from Rs. 160.06 billion at March 31, 2005, reflecting increase in investments in insurance and
international subsidiaries, pass-through certificates and credit-linked notes.
Total assets (gross) of overseas branches (including overseas banking unit at SEEPZ, Mumbai) increased
117.3% to Rs. 275.86 billion at March 31, 2006 from Rs. 126.96 billion at March 31, 2005.
The Bank’s rural and agri-lending portfolio (including consumer finance in rural areas) increased to
Rs. 162.79 billion at March 31, 2006.
The Bank’s equity share capital and reserves at March 31, 2006 increased by 76.9% to Rs. 222.06 billion
from Rs. 125.50 billion at March 31, 2005, as a result of the equity capital of Rs. 80.01 billion raised during
the year and the retained profit for the year. Total deposits increased 65.4% to Rs. 1,650.83 billion at
March 31, 2006 from Rs. 998.19 billion at March 31, 2005. ICICI Bank’s savings account deposits increased
83.8% to Rs. 209.37 billion at March 31, 2006 from Rs. 113.92 billion at March 31, 2005, while current
account deposits increased 29.1% to Rs. 165.73 billion at March 31, 2006 from Rs. 128.37 billion at
March 31, 2005. Term deposits increased by 68.8% to Rs. 1,275.73 billion at March 31, 2006 from
Rs. 755.90 billion at March 31, 2005. Of the term deposits, value-added deposits linked to savings accounts
totalled about Rs. 100.62 billion at March 31, 2006.
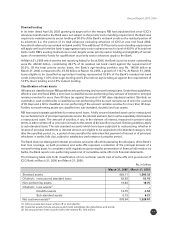
Off Balance Sheet Items, Commitments and Contingencies
The following table sets forth, for the periods indicated, the break-up of contingent liabilities.
Rs. in billion, except percentages
March 31, March 31, % change
2005 2006
Liability on account of outstanding forward exchange contracts 714.85 918.31 28.5
Currency swaps 112.96 172.42 52.6
Interest rate swaps, currency options and interest rate futures 1,519.22 2,471.92 62.7
Guarantees given on behalf of constituents
– In India 140.44 170.91 21.7
– Outside India 15.97 20.12 26.0
Acceptances, endorsements and other obligations 74.12 106.87 44.2
Claims against the bank not acknowledged as debts 27.46 29.78 8.4
Liabilities for partly paid investments 0.17 0.17 –
Other items for which the bank is contingently liable 76.35 59.84 (21.6)
Total 2,681.54 3,950.34 47.3