ICICI Bank 2006 Annual Report Download - page 43
Download and view the complete annual report
Please find page 43 of the 2006 ICICI Bank annual report below. You can navigate through the pages in the report by either clicking on the pages listed below, or by using the keyword search tool below to find specific information within the annual report.-
 1
1 -
2
-
3
-
4
-
5
-
6
-
7
-
8
-
9
-
10
-
11
-
12
-
13
-
14
-
15
-
16
-
17
-
18
-
19
-
20
-
21
-
22
-
23
-
24
-
25
-
26
-
27
-
28
-
29
-
30
-
31
-
32
-
 33
33 -
 34
34 -
 35
35 -
 36
36 -
 37
37 -
 38
38 -
 39
39 -
 40
40 -
 41
41 -
 42
42 -
 43
43 -
 44
44 -
 45
45 -
 46
46 -
 47
47 -
 48
48 -
 49
49 -
 50
50 -
 51
51 -
 52
52 -
 53
53 -
54
-
55
-
56
-
57
-
58
-
59
-
60
-
61
-
62
-
63
-
64
-
65
-
66
-
67
-
68
-
69
-
70
-
71
-
72
-
73
-
74
-
75
-
76
-
77
-
78
-
79
-
80
-
81
-
82
-
83
-
84
-
85
-
86
-
87
-
88
-
89
-
90
-
91
-
92
-
93
-
94
-
95
-
96
-
97
-
98
-
99
-
100
-
101
-
102
-
103
-
104
-
105
-
106
-
107
-
108
-
109
-
110
-
111
-
112
-
113
-
114
-
115
-
116
-
117
-
118
-
119
-
120
-
121
-
122
-
123
-
124
-
125
-
126
-
127
-
128
-
129
-
130
-
131
-
132
-
133
-
134
-
135
-
136
-
137
 |
 |

42
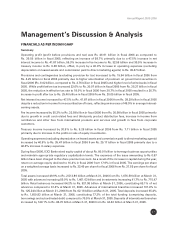
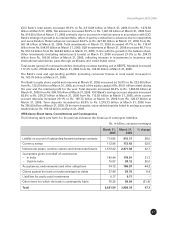
Management’s Discussion & Analysis
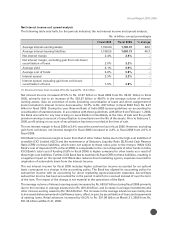
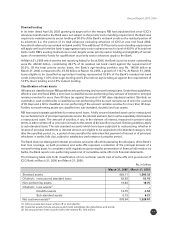
Operating results data
The following table sets forth, for the periods indicated, the operating results data.
Rs. in billion, except percentages
Fiscal 2005 Fiscal 2006 % change
Interest income 94.10 137.84 46.5
Interest expense 65.71 95.97 46.1
Net interest income 28.39 41.87 47.5
Non-interest income 27.05 40.55 49.9
- Fee income(1) 20.98 32.59 55.3
- Lease income 4.01 3.61 (10.0)
- Others 2.06 4.35 111.2
Core operating income 55.44 82.42 48.7
Operating expenses 25.17 35.47 40.9
Direct marketing agency (DMA) expense(2) 4.85 6.55 35.1
Lease depreciation, net of lease equalization 2.97 2.77 (6.7)
Core operating profit 22.45 37.63 67.6
Treasury income(3) 7.11 9.28 30.5
Operating profit 29.56 46.91 58.7
Provisions, net of write-backs 4.29 15.94 271.6
Profit before tax 25.27 30.97 22.6
Tax, net of deferred tax(4) 5.22 5.57 6.7
Profit after tax 20.05 25.40 26.7
(1) Includes merchant foreign exchange income.
(2) Other than on car loans, which is reduced from interest income.
(3) Excludes merchant foreign exchange income.
(4) Including fringe benefit tax.
(5) All amounts have been rounded off to the nearest Rs. 10.0 million.
Key ratios
The following table sets forth, for the periods indicated, the key ratios.
Fiscal 2005 Fiscal 2006
Return on average equity (%)(1) 17.9 16.4(2)
Return on average assets (%)(3) 1.4 1.3
Earnings per share (Rs.) 27.6 32.5
Book value (Rs.) 168.6 248.6
Fee to income (%) 35.2 36.6
Cost to income (%)(4) 42.2 39.9
(1) Return on equity is based on average of balances outstanding at the end of each quarter.
(2) Additional capital of Rs. 80.01 billion raised in fiscal 2006.
(3) Return on assets is based on average daily assets.
(4) Cost represents operating expense excluding DMA expense and lease depreciation. Income represents net interest
income, treasury income and non-interest income and is net of lease depreciation.