ICICI Bank 2006 Annual Report Download - page 106
Download and view the complete annual report
Please find page 106 of the 2006 ICICI Bank annual report below. You can navigate through the pages in the report by either clicking on the pages listed below, or by using the keyword search tool below to find specific information within the annual report.-
 1
1 -
2
-
3
-
4
-
5
-
6
-
7
-
8
-
9
-
10
-
11
-
12
-
13
-
14
-
15
-
16
-
17
-
18
-
19
-
20
-
21
-
22
-
23
-
24
-
25
-
26
-
27
-
28
-
29
-
30
-
31
-
32
-
33
-
34
-
35
-
36
-
37
-
38
-
39
-
40
-
41
-
42
-
43
-
44
-
45
-
46
-
47
-
48
-
49
-
50
-
51
-
52
-
53
-
54
-
55
-
56
-
57
-
58
-
59
-
60
-
61
-
62
-
63
-
64
-
65
-
66
-
67
-
68
-
69
-
70
-
71
-
72
-
73
-
74
-
75
-
76
-
77
-
78
-
79
-
80
-
81
-
82
-
83
-
84
-
85
-
86
-
87
-
88
-
89
-
90
-
91
-
92
-
93
-
94
-
95
-
 96
96 -
 97
97 -
 98
98 -
 99
99 -
 100
100 -
 101
101 -
 102
102 -
 103
103 -
 104
104 -
 105
105 -
 106
106 -
 107
107 -
 108
108 -
 109
109 -
 110
110 -
 111
111 -
 112
112 -
 113
113 -
 114
114 -
 115
115 -
 116
116 -
117
-
118
-
119
-
120
-
121
-
122
-
123
-
124
-
125
-
126
-
127
-
128
-
129
-
130
-
131
-
132
-
133
-
134
-
135
-
136
-
137
 |
 |

F47
schedules
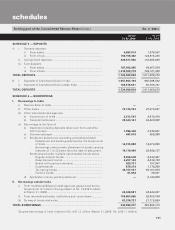
SCHEDULE 8 — INVESTMENTS [net of provisions]
I. Investments in India
i) Government securities ...................................................................... 527,979,787 359,865,891
ii) Other approved securities ................................................................. 356,349 318,890
iii) Shares (includes equity and preference shares) ............................... 38,738,178 32,027,936
iv) Debentures and bonds ...................................................................... 27,896,238 35,035,525
v) Others (commercial paper, mutual fund units, pass through
certificates, security receipts etc.) 1.................................................. 166,027,372 101,247,552
TOTAL ........................................................................................................ 760,997,924 528,495,794
II. Investments outside India
i) Government securities ...................................................................... 10,701,989 377,947
ii) Others ................................................................................................ 68,438,909 17,642,421
TOTAL ........................................................................................................ 79,140,898 18,020,368
TOTAL INVESTMENTS ..................................................................................... 840,138,822 546,516,162
1. Includes assets held to cover linked liabilities of life insurance business of Rs. 70,788.5 million
(March 31, 2005: Rs. 26,540.6 million).
SCHEDULE 9 — ADVANCES (net of provisions)
A. i) Bills purchased and discounted ........................................................ 63,426,766 43,984,209
ii) Cash credits, overdrafts and loans repayable on demand ................ 258,593,077 123,344,410
iii) Term loans.......................................................................................... 1,209,251,205 772,559,072
iv) Securitisation, finance lease and hire purchase receivables 1.......... 31,332,154 24,211,871
TOTAL ........................................................................................................ 1,562,603,202 964,099,562
B. i) Secured by tangible assets [includes advances against Book debt]21,290,962,380 827,679,644
ii) Covered by Bank/Government guarantees ....................................... 15,235,139 10,795,838
iii) Unsecured.......................................................................................... 256,405,683 125,624,080
TOTAL ........................................................................................................ 1,562,603,202 964,099,562
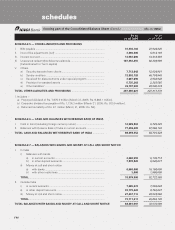
C. I. Advances in India
i) Priority sector ............................................................................. 447,310,487 215,591,362
ii) Public sector .............................................................................. 11,572,043 11,154,310
iii) Banks ......................................................................................... 48,863 4,517,162
iv) Others ........................................................................................ 913,884,547 650,547,563
TOTAL ........................................................................................................ 1,372,815,940 881,810,397
II. Advances outside India
i) Due from banks ......................................................................... 25,492,873 10,375,851
ii) Due from others
a) Bills purchased and discounted ........................................ 44,128,091 24,884,221
b) Syndicated loans................................................................ 39,708,130 11,925,394
c) Others ................................................................................ 80,458,168 35,103,699
TOTAL ........................................................................................................ 189,787,262 82,289,165
TOTAL ADVANCES ........................................................................................... 1,562,603,202 964,099,562
1.Includes receivables under lease amounting to Rs. 695.1 million (March 31, 2005 : Rs. 913.6 million).
2.Includes a loan of Rs. 16,028.7 million (March 31, 2005: Rs. Nil) for which security is being created.
As on As on
31.03.2006 31.03.2005
(Rs. in ‘000s)forming part of the Consolidated Balance Sheet (Contd.)