ICICI Bank 2006 Annual Report Download - page 101
Download and view the complete annual report
Please find page 101 of the 2006 ICICI Bank annual report below. You can navigate through the pages in the report by either clicking on the pages listed below, or by using the keyword search tool below to find specific information within the annual report.-
 1
1 -
2
-
3
-
4
-
5
-
6
-
7
-
8
-
9
-
10
-
11
-
12
-
13
-
14
-
15
-
16
-
17
-
18
-
19
-
20
-
21
-
22
-
23
-
24
-
25
-
26
-
27
-
28
-
29
-
30
-
31
-
32
-
33
-
34
-
35
-
36
-
37
-
38
-
39
-
40
-
41
-
42
-
43
-
44
-
45
-
46
-
47
-
48
-
49
-
50
-
51
-
52
-
53
-
54
-
55
-
56
-
57
-
58
-
59
-
60
-
61
-
62
-
63
-
64
-
65
-
66
-
67
-
68
-
69
-
70
-
71
-
72
-
73
-
74
-
75
-
76
-
77
-
78
-
79
-
80
-
81
-
82
-
83
-
84
-
85
-
86
-
87
-
88
-
89
-
90
-
 91
91 -
 92
92 -
 93
93 -
 94
94 -
 95
95 -
 96
96 -
 97
97 -
 98
98 -
 99
99 -
 100
100 -
 101
101 -
 102
102 -
 103
103 -
 104
104 -
 105
105 -
 106
106 -
 107
107 -
 108
108 -
 109
109 -
 110
110 -
 111
111 -
112
-
113
-
114
-
115
-
116
-
117
-
118
-
119
-
120
-
121
-
122
-
123
-
124
-
125
-
126
-
127
-
128
-
129
-
130
-
131
-
132
-
133
-
134
-
135
-
136
-
137
 |
 |

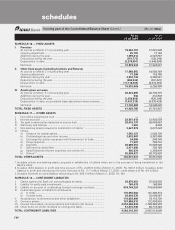
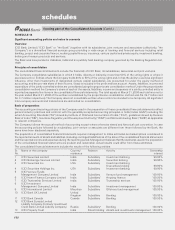
F42
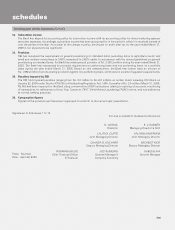
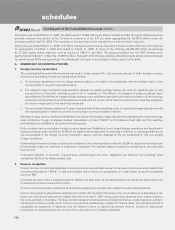
Significant Accounting Policies and Notes to Accounts (refer Schedule 18)
The Schedules referred to above form an integral part of the consolidated balance sheet
consolidated cash flow statement
for the year ended March 31, 2006
Particulars Year ended Year ended
31.03.2006 31.03.2005
Cash flow from operating activities
Net profit before taxes ........................................................................... 31,198,896 24,207,093
Adjustments for :
Depreciation and amortisation ............................................................... 9,462,631 9,778,945
Net (appreciation) / depreciation on investments .................................. 8,660,775 5,287,521
Provision in respect of non-performing assets (including
prudential provision on standard assets) ............................................... 8,117,173 (889,859)
Provision for contingencies & others ...................................................... 203,564 85,984
(Profit) / loss on sale of fixed assets ....................................................... (51,832) 9,232
57,591,207 38,478,916
Adjustments for :
(Increase) / decrease in investments ...................................................... (202,720,286) (50,917,262)
(Increase) / decrease in advances .......................................................... (606,401,452) (313,691,838)
Increase / (decrease) in borrowings ....................................................... 82,006,471 60,236,038
Increase / (decrease) in deposits ............................................................ 713,348,700 330,298,939
(Increase) / decrease in other assets...................................................... (45,598,461) (28,297,407)
Increase / (decrease) in other liabilities and provisions ......................... 81,889,315 74,907,141
22,524,287 72,535,611
(Payment) / refund of taxes (net) ............................................................ (10,198,463) (9,475,531)
Net cash generated from operating activities .................................... (A) 69,917,031 101,538,996
Cash flow from investing activities
Purchase of fixed assets ........................................................................ (6,557,240) (5,914,656)
Proceeds from sale of fixed assets ........................................................ 1,010,888 323,177
(Purchase) / sale of long-term investments ............................................ (96,168,425) (37,444,165)
Acquisition of subsidiaries (net of cash acquired) ................................. (688,736) —
Net cash generated from investing activities ..................................... (B) (102,403,513) (43,035,644)
Cash flow from financing activities
Proceeds from issue of share capital ..................................................... 79,039,409 31,922,933
Amount received on exercise of stock options & calls in arrears .......... 811,100 649,861
Net proceeds / (repayment) of bonds (including subordinated debts) .. 6,534,092 (38,366,923)
Dividend and dividend tax paid .............................................................. (7,598,693) (6,381,725)
Net cash generated from financing activities ..................................... (C) 78,785,908 (12,175,854)
Effect of exchange fluctuation on translation reserve ....................... (D) (25,495) 65,418
Net increase / (decrease) in cash and cash equivalents .................... (A) + (B) + (C) + (D) 46,273,931 46,392,916
Cash and cash equivalents as at 1st April........................................... 136,277,018 89,884,102
Cash and cash equivalents as at 31st March ...................................... 182,550,949 136,277,018
(Rs. in ‘000s)
N. VAGHUL
Chairman
LALITA D. GUPTE
Joint Managing Director
CHANDA D. KOCHHAR
Deputy Managing Director
JYOTIN MEHTA
General Manager &
Company Secretary
K. V. KAMATH
Managing Director & CEO
KALPANA MORPARIA
Joint Managing Director
NACHIKET MOR
Deputy Managing Director
RAKESH JHA
General Manager
For S. R. Batliboi & Co.
Chartered Accountants
per VIREN H. MEHTA
a Partner
Membership No. : 048749
Place : Mumbai
Date : April 29, 2006
As per our Report of even date. For and on behalf of the Board of Directors
VISHAKHA MULYE
Chief Financial Officer &
Treasurer