HSBC 2008 Annual Report Download - page 92
Download and view the complete annual report
Please find page 92 of the 2008 HSBC annual report below. You can navigate through the pages in the report by either clicking on the pages listed below, or by using the keyword search tool below to find specific information within the annual report.-
 1
1 -
2
-
3
-
4
-
5
-
6
-
7
-
8
-
9
-
10
-
11
-
12
-
13
-
14
-
15
-
16
-
17
-
18
-
19
-
20
-
21
-
22
-
23
-
24
-
25
-
26
-
27
-
28
-
29
-
30
-
31
-
32
-
33
-
34
-
35
-
36
-
37
-
38
-
39
-
40
-
41
-
42
-
43
-
44
-
45
-
46
-
47
-
48
-
49
-
50
-
51
-
52
-
53
-
54
-
55
-
56
-
57
-
58
-
59
-
60
-
61
-
62
-
63
-
64
-
65
-
66
-
67
-
68
-
69
-
70
-
71
-
72
-
73
-
74
-
75
-
76
-
77
-
78
-
79
-
80
-
81
-
 82
82 -
 83
83 -
 84
84 -
 85
85 -
 86
86 -
 87
87 -
 88
88 -
 89
89 -
 90
90 -
 91
91 -
 92
92 -
 93
93 -
 94
94 -
 95
95 -
 96
96 -
 97
97 -
 98
98 -
 99
99 -
 100
100 -
 101
101 -
 102
102 -
103
-
104
-
105
-
106
-
107
-
108
-
109
-
110
-
111
-
112
-
113
-
114
-
115
-
116
-
117
-
118
-
119
-
120
-
121
-
122
-
123
-
124
-
125
-
126
-
127
-
128
-
129
-
130
-
131
-
132
-
133
-
134
-
135
-
136
-
137
-
138
-
139
-
140
-
141
-
142
-
143
-
144
-
145
-
146
-
147
-
148
-
149
-
150
-
151
-
152
-
153
-
154
-
155
-
156
-
157
-
158
-
159
-
160
-
161
-
162
-
163
-
164
-
165
-
166
-
167
-
168
-
169
-
170
-
171
-
172
-
173
-
174
-
175
-
176
-
177
-
178
-
179
-
180
-
181
-
182
-
183
-
184
-
185
-
186
-
187
-
188
-
189
-
190
-
191
-
192
-
193
-
194
-
195
-
196
-
197
-
198
-
199
-
200
-
201
-
202
-
203
-
204
-
205
-
206
-
207
-
208
-
209
-
210
-
211
-
212
-
213
-
214
-
215
-
216
-
217
-
218
-
219
-
220
-
221
-
222
-
223
-
224
-
225
-
226
-
227
-
228
-
229
-
230
-
231
-
232
-
233
-
234
-
235
-
236
-
237
-
238
-
239
-
240
-
241
-
242
-
243
-
244
-
245
-
246
-
247
-
248
-
249
-
250
-
251
-
252
-
253
-
254
-
255
-
256
-
257
-
258
-
259
-
260
-
261
-
262
-
263
-
264
-
265
-
266
-
267
-
268
-
269
-
270
-
271
-
272
-
273
-
274
-
275
-
276
-
277
-
278
-
279
-
280
-
281
-
282
-
283
-
284
-
285
-
286
-
287
-
288
-
289
-
290
-
291
-
292
-
293
-
294
-
295
-
296
-
297
-
298
-
299
-
300
-
301
-
302
-
303
-
304
-
305
-
306
-
307
-
308
-
309
-
310
-
311
-
312
-
313
-
314
-
315
-
316
-
317
-
318
-
319
-
320
-
321
-
322
-
323
-
324
-
325
-
326
-
327
-
328
-
329
-
330
-
331
-
332
-
333
-
334
-
335
-
336
-
337
-
338
-
339
-
340
-
341
-
342
-
343
-
344
-
345
-
346
-
347
-
348
-
349
-
350
-
351
-
352
-
353
-
354
-
355
-
356
-
357
-
358
-
359
-
360
-
361
-
362
-
363
-
364
-
365
-
366
-
367
-
368
-
369
-
370
-
371
-
372
-
373
-
374
-
375
-
376
-
377
-
378
-
379
-
380
-
381
-
382
-
383
-
384
-
385
-
386
-
387
-
388
-
389
-
390
-
391
-
392
-
393
-
394
-
395
-
396
-
397
-
398
-
399
-
400
-
401
-
402
-
403
-
404
-
405
-
406
-
407
-
408
-
409
-
410
-
411
-
412
-
413
-
414
-
415
-
416
-
417
-
418
-
419
-
420
-
421
-
422
-
423
-
424
-
425
-
426
-
427
-
428
-
429
-
430
-
431
-
432
-
433
-
434
-
435
-
436
-
437
-
438
-
439
-
440
-
441
-
442
-
443
-
444
-
445
-
446
-
447
-
448
-
449
-
450
-
451
-
452
-
453
-
454
-
455
-
456
-
457
-
458
-
459
-
460
-
461
-
462
-
463
-
464
-
465
-
466
-
467
-
468
-
469
-
470
-
471
-
472
 |
 |

HSBC HOLDINGS PLC
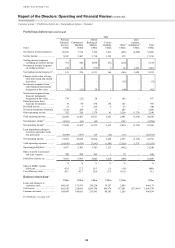
Report of the Directors: Operating and Financial Review (continued)
Geographical regions > Europe > 2008
90
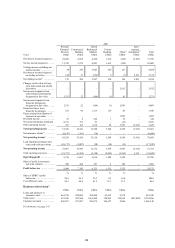
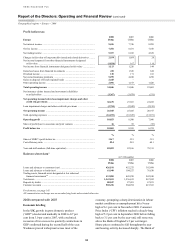
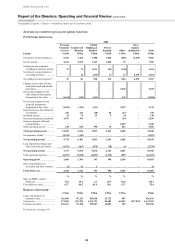
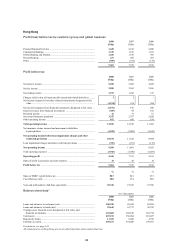
Profit before tax
2008 2007 2006
Europe US$m US$m US$m
Net interest income .......................................................................................... 9,696 7,746 8,289
Net fee income ................................................................................................. 7,492 8,431 7,108
Net trading income .......................................................................................... 5,357 6,943 4,529
Changes in fair value of long-term debt issued and related derivatives ......... 2,939 1,059 28
Net income/(expense) from other financial instruments designated
at fair value ................................................................................................. (1,826) 167 116
Net income from financial instruments designated at fair value .................... 1,113 1,226 144
Gains less losses from financial investments .................................................. 418 1,326 624
Dividend income .............................................................................................. 130 171 183
Net earned insurance premiums ...................................................................... 5,299 4,010 1,298
Gains on disposal of French regional banks ................................................... 2,445 – –
Other operating income ................................................................................... 2,096 1,193 1,428
Total operating income ................................................................................. 34,046 31,046 23,603
Net insurance claims incurred and movement in liabilities
to policyholders .......................................................................................... (3,367) (3,479) (531)
Net operating income before loan impairment charges and other
credit risk provisions ................................................................................ 30,679 27,567 23,072
Loan impairment charges and other credit risk provisions ............................. (3,754) (2,542) (2,155)
Net operating income .................................................................................... 26,925 25,025 20,917
Total operating expenses ................................................................................. (16,072) (16,525) (13,871)
Operating profit ............................................................................................. 10,853 8,500 7,046
Share of profit/(loss) in associates and joint ventures .................................... 16 95 (72)
Profit before tax ............................................................................................. 10,869 8,595 6,974
% % %
Share of HSBC’s profit before tax .................................................................. 116.7 35.5 31.5
Cost efficiency ratio ........................................................................................ 52.4 59.9 60.1
Year-end staff numbers (full-time equivalent) ................................................ 82,093 82,166 78,311
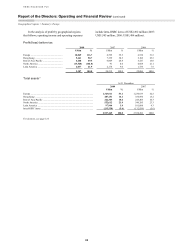
Balance sheet data15
At 31 December
2008 2007 2006
US$m US$m US$m
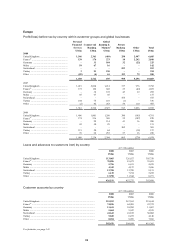
Loans and advances to customers (net) ........................................................... 426,191 452,275 392,499
Loans and advances to banks (net) .................................................................. 61,949 104,527 76,830
Trading assets, financial assets designated at fair value and
financial investments20 ............................................................................... 433,885
445,258 242,010
Total assets ...................................................................................................... 1,343,011 1,236,633 867,032
Deposits by banks ............................................................................................ 80,847 87,491 67,821
Customer accounts ........................................................................................... 502,476 504,954 419,365
For footnotes, see page 143.
All commentaries on Europe are on an underlying basis unless stated otherwise.
2008 compared with 2007
Economic briefing
In the UK, growth in gross domestic product
(‘GDP’) decelerated markedly in 2008 to 0.7 per
cent from 3.0 per cent in 2007, with a technical
recession of two successive quarterly contractions in
GDP confirmed during the second half of the year.
Weakness proved widespread across most of the
economy, prompting a sharp deterioration in labour
market conditions as unemployment hit a 9-year
high of 6.1 per cent in November 2008. Consumer
Price Index (‘CPI’) inflation reached a decade-long
high of 5.2 per cent in September 2008 before falling
back to 3.1 per cent by the year-end, still some way
above the Bank of England’s 2 per cent target.
House prices continued to fall throughout the year
and housing activity decreased sharply. The Bank of