HSBC 2008 Annual Report Download - page 77
Download and view the complete annual report
Please find page 77 of the 2008 HSBC annual report below. You can navigate through the pages in the report by either clicking on the pages listed below, or by using the keyword search tool below to find specific information within the annual report.-
 1
1 -
2
-
3
-
4
-
5
-
6
-
7
-
8
-
9
-
10
-
11
-
12
-
13
-
14
-
15
-
16
-
17
-
18
-
19
-
20
-
21
-
22
-
23
-
24
-
25
-
26
-
27
-
28
-
29
-
30
-
31
-
32
-
33
-
34
-
35
-
36
-
37
-
38
-
39
-
40
-
41
-
42
-
43
-
44
-
45
-
46
-
47
-
48
-
49
-
50
-
51
-
52
-
53
-
54
-
55
-
56
-
57
-
58
-
59
-
60
-
61
-
62
-
63
-
64
-
65
-
66
-
 67
67 -
 68
68 -
 69
69 -
 70
70 -
 71
71 -
 72
72 -
 73
73 -
 74
74 -
 75
75 -
 76
76 -
 77
77 -
 78
78 -
 79
79 -
 80
80 -
 81
81 -
 82
82 -
 83
83 -
 84
84 -
 85
85 -
 86
86 -
 87
87 -
88
-
89
-
90
-
91
-
92
-
93
-
94
-
95
-
96
-
97
-
98
-
99
-
100
-
101
-
102
-
103
-
104
-
105
-
106
-
107
-
108
-
109
-
110
-
111
-
112
-
113
-
114
-
115
-
116
-
117
-
118
-
119
-
120
-
121
-
122
-
123
-
124
-
125
-
126
-
127
-
128
-
129
-
130
-
131
-
132
-
133
-
134
-
135
-
136
-
137
-
138
-
139
-
140
-
141
-
142
-
143
-
144
-
145
-
146
-
147
-
148
-
149
-
150
-
151
-
152
-
153
-
154
-
155
-
156
-
157
-
158
-
159
-
160
-
161
-
162
-
163
-
164
-
165
-
166
-
167
-
168
-
169
-
170
-
171
-
172
-
173
-
174
-
175
-
176
-
177
-
178
-
179
-
180
-
181
-
182
-
183
-
184
-
185
-
186
-
187
-
188
-
189
-
190
-
191
-
192
-
193
-
194
-
195
-
196
-
197
-
198
-
199
-
200
-
201
-
202
-
203
-
204
-
205
-
206
-
207
-
208
-
209
-
210
-
211
-
212
-
213
-
214
-
215
-
216
-
217
-
218
-
219
-
220
-
221
-
222
-
223
-
224
-
225
-
226
-
227
-
228
-
229
-
230
-
231
-
232
-
233
-
234
-
235
-
236
-
237
-
238
-
239
-
240
-
241
-
242
-
243
-
244
-
245
-
246
-
247
-
248
-
249
-
250
-
251
-
252
-
253
-
254
-
255
-
256
-
257
-
258
-
259
-
260
-
261
-
262
-
263
-
264
-
265
-
266
-
267
-
268
-
269
-
270
-
271
-
272
-
273
-
274
-
275
-
276
-
277
-
278
-
279
-
280
-
281
-
282
-
283
-
284
-
285
-
286
-
287
-
288
-
289
-
290
-
291
-
292
-
293
-
294
-
295
-
296
-
297
-
298
-
299
-
300
-
301
-
302
-
303
-
304
-
305
-
306
-
307
-
308
-
309
-
310
-
311
-
312
-
313
-
314
-
315
-
316
-
317
-
318
-
319
-
320
-
321
-
322
-
323
-
324
-
325
-
326
-
327
-
328
-
329
-
330
-
331
-
332
-
333
-
334
-
335
-
336
-
337
-
338
-
339
-
340
-
341
-
342
-
343
-
344
-
345
-
346
-
347
-
348
-
349
-
350
-
351
-
352
-
353
-
354
-
355
-
356
-
357
-
358
-
359
-
360
-
361
-
362
-
363
-
364
-
365
-
366
-
367
-
368
-
369
-
370
-
371
-
372
-
373
-
374
-
375
-
376
-
377
-
378
-
379
-
380
-
381
-
382
-
383
-
384
-
385
-
386
-
387
-
388
-
389
-
390
-
391
-
392
-
393
-
394
-
395
-
396
-
397
-
398
-
399
-
400
-
401
-
402
-
403
-
404
-
405
-
406
-
407
-
408
-
409
-
410
-
411
-
412
-
413
-
414
-
415
-
416
-
417
-
418
-
419
-
420
-
421
-
422
-
423
-
424
-
425
-
426
-
427
-
428
-
429
-
430
-
431
-
432
-
433
-
434
-
435
-
436
-
437
-
438
-
439
-
440
-
441
-
442
-
443
-
444
-
445
-
446
-
447
-
448
-
449
-
450
-
451
-
452
-
453
-
454
-
455
-
456
-
457
-
458
-
459
-
460
-
461
-
462
-
463
-
464
-
465
-
466
-
467
-
468
-
469
-
470
-
471
-
472
 |
 |

75
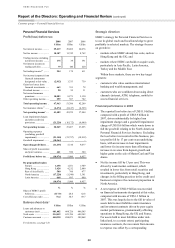
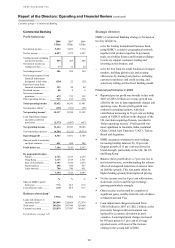
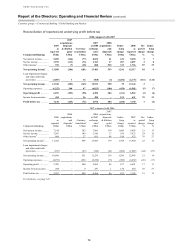
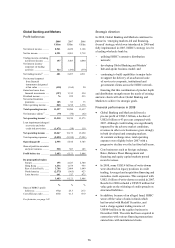
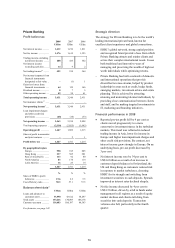
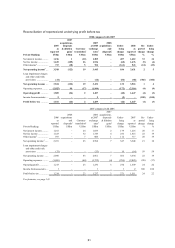
Global Banking and Markets
Profit before tax
2008 2007 2006
US$m US$m US$m
Net interest income ........... 8,541 4,430 3,168
Net fee income .................. 4,291 4,901 3,718
Trading income excluding
net interest income ......... 157 3,503 4,890
Net interest income/
(expense) on trading
activities ......................... 324 (236) (379)
Net trading income16 ......... 481 3,267 4,511
Net income/(expense)
from financial
instruments designated
at fair value ................... (438) (164) 20
Gains less losses from
financial investments ..... (327) 1,313 534
Dividend income ............... 76 222 235
Net earned insurance
premiums ....................... 105 93 73
Other operating income .... 868 1,218 1,378
Total operating income .. 13,597 15,280 13,637
Net insurance claims17 ...... (79) (70) (62)
Net operating income5..... 13,518 15,210 13,575
Loan impairment (charges)/
recoveries and other
credit risk provisions .... (1,471) (38) 119
Net operating income ..... 12,047 15,172 13,694
Total operating expenses .. (9,092) (9,358) (7,991)
Operating profit .............. 2,955 5,814 5,703
Share of profit in associates
and joint ventures ........... 528 307 103
Profit before tax .............. 3,483 6,121 5,806
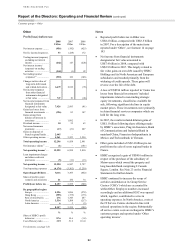
By geographical region
Europe ............................ 195 2,527 2,304
Hong Kong ..................... 1,436 1,578 955
Rest of Asia-Pacific ....... 3,786 2,464 1,649
North America ............... (2,575) (965) 423
Latin America ................ 641 517 475
3,483 6,121 5,806
% % %
Share of HSBC’s profit
before tax ....................... 37.4
25.3 26.3
Cost efficiency ratio .......... 67.3 61.5 58.9
For footnotes, see page 143.
Strategic direction
In 2008, Global Banking and Markets continued to
pursue its ‘emerging markets-led and financing-
focused’ strategy, which was introduced in 2006 and
fully implemented in 2007. HSBC’s strategy is to be
a leading wholesale bank by:
– utilising HSBC’s extensive distribution
network;
– developing Global Banking and Markets’
hub-and-spoke business model; and
– continuing to build capabilities in major hubs
to support the delivery of an advanced suite
of services to corporate, institutional and
government clients across the HSBC network.
Ensuring that this combination of product depth
and distribution strength meets the needs of existing
and new clients will allow Global Banking and
Markets to achieve its strategic goals.
Financial performance in 2008
• Global Banking and Markets delivered a
pre-tax profit of US$3.5 billion, a decline of
US$2.6 billion or 43 per cent compared with
2007. Although credit trading was significantly
impacted by the adverse market conditions,
revenues in other core businesses grew strongly
in both developed and emerging markets.
At constant exchange rates, total operating
expenses were slightly below 2007 with a
progressive decline over the last four half-years.
• Core businesses such as foreign exchange,
Rates, Balance Sheet Management and
financing and equity capital markets posted
record revenues.
• In 2008, some US$5.4 billion of write-downs
were absorbed on legacy positions in credit
trading, leveraged and acquisition financing and
monoline credit exposures. This compared with
US$2.1 billion of write-downs recorded in 2007.
Results for 2008 included a US$529 million fair
value gain on the widening of credit spreads on
structured liabilities.
• In addition, because of an alleged fraud, HSBC
wrote off the value of units in funds which
had invested with Madoff Securities, and
took a charge against trading income of
US$984 million in the equities business in
December 2008. The units had been acquired in
connection with various financing transactions
entered into with institutional clients.