HSBC 2008 Annual Report Download - page 42
Download and view the complete annual report
Please find page 42 of the 2008 HSBC annual report below. You can navigate through the pages in the report by either clicking on the pages listed below, or by using the keyword search tool below to find specific information within the annual report.-
 1
1 -
2
-
3
-
4
-
5
-
6
-
7
-
8
-
9
-
10
-
11
-
12
-
13
-
14
-
15
-
16
-
17
-
18
-
19
-
20
-
21
-
22
-
23
-
24
-
25
-
26
-
27
-
28
-
29
-
30
-
31
-
 32
32 -
 33
33 -
 34
34 -
 35
35 -
 36
36 -
 37
37 -
 38
38 -
 39
39 -
 40
40 -
 41
41 -
 42
42 -
 43
43 -
 44
44 -
 45
45 -
 46
46 -
 47
47 -
 48
48 -
 49
49 -
 50
50 -
 51
51 -
 52
52 -
53
-
54
-
55
-
56
-
57
-
58
-
59
-
60
-
61
-
62
-
63
-
64
-
65
-
66
-
67
-
68
-
69
-
70
-
71
-
72
-
73
-
74
-
75
-
76
-
77
-
78
-
79
-
80
-
81
-
82
-
83
-
84
-
85
-
86
-
87
-
88
-
89
-
90
-
91
-
92
-
93
-
94
-
95
-
96
-
97
-
98
-
99
-
100
-
101
-
102
-
103
-
104
-
105
-
106
-
107
-
108
-
109
-
110
-
111
-
112
-
113
-
114
-
115
-
116
-
117
-
118
-
119
-
120
-
121
-
122
-
123
-
124
-
125
-
126
-
127
-
128
-
129
-
130
-
131
-
132
-
133
-
134
-
135
-
136
-
137
-
138
-
139
-
140
-
141
-
142
-
143
-
144
-
145
-
146
-
147
-
148
-
149
-
150
-
151
-
152
-
153
-
154
-
155
-
156
-
157
-
158
-
159
-
160
-
161
-
162
-
163
-
164
-
165
-
166
-
167
-
168
-
169
-
170
-
171
-
172
-
173
-
174
-
175
-
176
-
177
-
178
-
179
-
180
-
181
-
182
-
183
-
184
-
185
-
186
-
187
-
188
-
189
-
190
-
191
-
192
-
193
-
194
-
195
-
196
-
197
-
198
-
199
-
200
-
201
-
202
-
203
-
204
-
205
-
206
-
207
-
208
-
209
-
210
-
211
-
212
-
213
-
214
-
215
-
216
-
217
-
218
-
219
-
220
-
221
-
222
-
223
-
224
-
225
-
226
-
227
-
228
-
229
-
230
-
231
-
232
-
233
-
234
-
235
-
236
-
237
-
238
-
239
-
240
-
241
-
242
-
243
-
244
-
245
-
246
-
247
-
248
-
249
-
250
-
251
-
252
-
253
-
254
-
255
-
256
-
257
-
258
-
259
-
260
-
261
-
262
-
263
-
264
-
265
-
266
-
267
-
268
-
269
-
270
-
271
-
272
-
273
-
274
-
275
-
276
-
277
-
278
-
279
-
280
-
281
-
282
-
283
-
284
-
285
-
286
-
287
-
288
-
289
-
290
-
291
-
292
-
293
-
294
-
295
-
296
-
297
-
298
-
299
-
300
-
301
-
302
-
303
-
304
-
305
-
306
-
307
-
308
-
309
-
310
-
311
-
312
-
313
-
314
-
315
-
316
-
317
-
318
-
319
-
320
-
321
-
322
-
323
-
324
-
325
-
326
-
327
-
328
-
329
-
330
-
331
-
332
-
333
-
334
-
335
-
336
-
337
-
338
-
339
-
340
-
341
-
342
-
343
-
344
-
345
-
346
-
347
-
348
-
349
-
350
-
351
-
352
-
353
-
354
-
355
-
356
-
357
-
358
-
359
-
360
-
361
-
362
-
363
-
364
-
365
-
366
-
367
-
368
-
369
-
370
-
371
-
372
-
373
-
374
-
375
-
376
-
377
-
378
-
379
-
380
-
381
-
382
-
383
-
384
-
385
-
386
-
387
-
388
-
389
-
390
-
391
-
392
-
393
-
394
-
395
-
396
-
397
-
398
-
399
-
400
-
401
-
402
-
403
-
404
-
405
-
406
-
407
-
408
-
409
-
410
-
411
-
412
-
413
-
414
-
415
-
416
-
417
-
418
-
419
-
420
-
421
-
422
-
423
-
424
-
425
-
426
-
427
-
428
-
429
-
430
-
431
-
432
-
433
-
434
-
435
-
436
-
437
-
438
-
439
-
440
-
441
-
442
-
443
-
444
-
445
-
446
-
447
-
448
-
449
-
450
-
451
-
452
-
453
-
454
-
455
-
456
-
457
-
458
-
459
-
460
-
461
-
462
-
463
-
464
-
465
-
466
-
467
-
468
-
469
-
470
-
471
-
472
 |
 |
HSBC HOLDINGS PLC
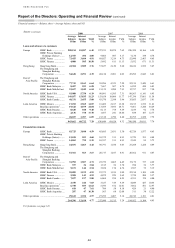
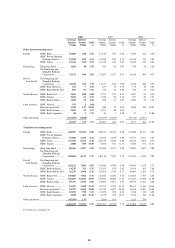
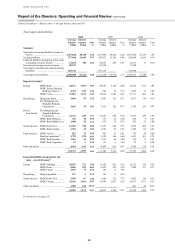
Report of the Directors: Operating and Financial Review (continued)
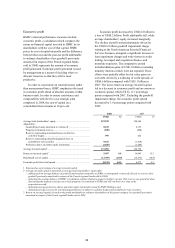
Financial summary > Balance sheet > Movement in 2008
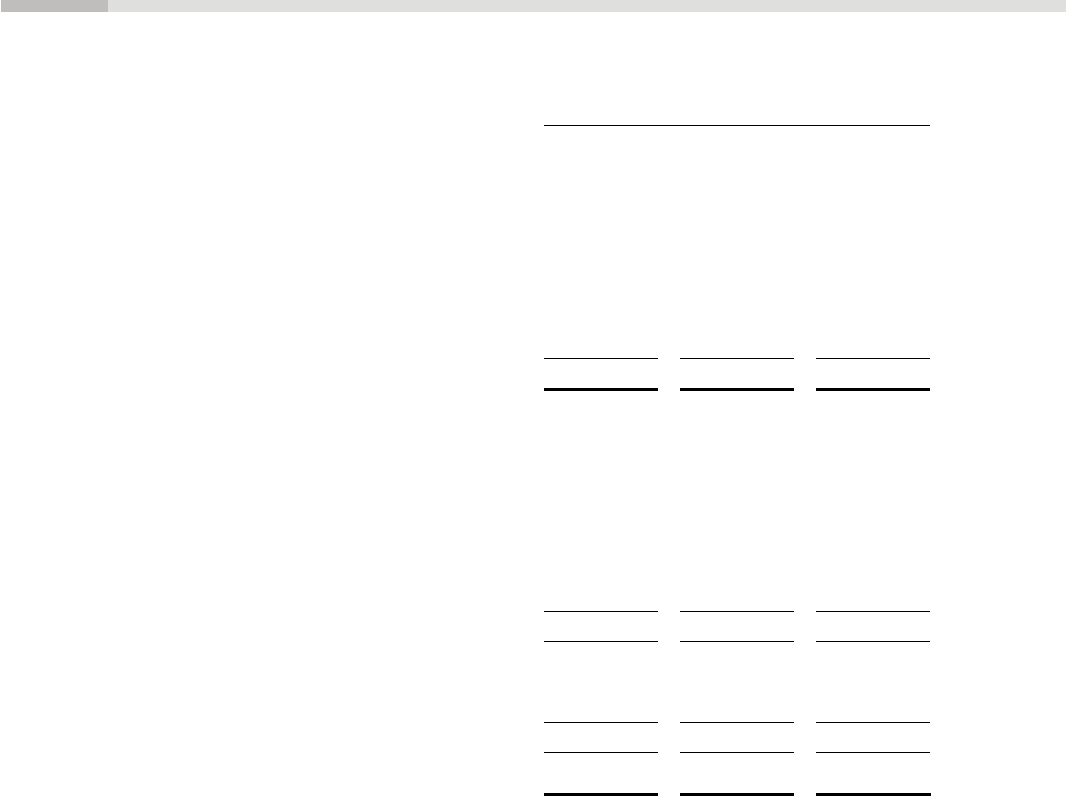
40
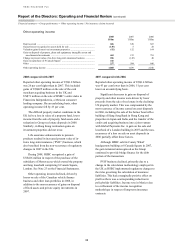
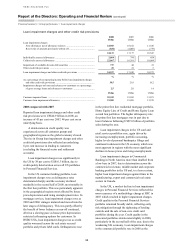
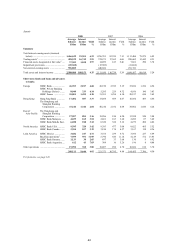
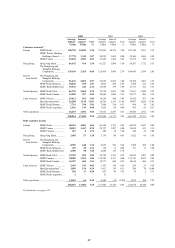
Balance sheet
At 31 December
2008
US$m
2007
US$m
2006
US$m
ASSETS
Cash and balances at central banks ................................................................. 52,396 21,765 12,732
Trading assets .................................................................................................. 427,329 445,968 328,147
Financial assets designated at fair value ......................................................... 28,533 41,564 20,573
Derivatives ....................................................................................................... 494,876 187,854 103,702
Loans and advances to banks .......................................................................... 153,766 237,366 185,205
Loans and advances to customers ................................................................... 932,868 981,548 868,133
Financial investments ...................................................................................... 300,235 283,000 204,806
Other assets ...................................................................................................... 137,462 155,201 137,460
Total assets ..................................................................................................... 2,527,465 2,354,266 1,860,758
LIABILITIES AND EQUITY
Liabilities
Deposits by banks ............................................................................................ 130,084 132,181 99,694
Customer accounts ........................................................................................... 1,115,327 1,096,140 896,834
Trading liabilities ............................................................................................. 247,652 314,580 226,608
Financial liabilities designated at fair value .................................................... 74,587 89,939 70,211
Derivatives ....................................................................................................... 487,060 183,393 101,478
Debt securities in issue .................................................................................... 179,693 246,579 230,325
Liabilities under insurance contracts ............................................................... 43,683 42,606 17,670
Other liabilities ................................................................................................ 149,150 113,432 103,010
Total liabilities ................................................................................................ 2,427,236 2,218,850 1,745,830
Equity
Total shareholders’ equity ............................................................................... 93,591 128,160 108,352
Minority interests ............................................................................................. 6,638 7,256 6,576
Total equity .................................................................................................... 100,229 135,416 114,928
Total equity and liabilities ............................................................................ 2,527,465 2,354,266 1,860,758
A more detailed consolidated balance sheet is contained in the Financial Statements on page 334.
Movement from 31 December 2007 to
31 December 2008
Total assets amounted to US$2.5 trillion, 7 per cent
higher than at 31 December 2007. After excluding
currency movements, the disposal of HSBC’s French
regional subsidiaries and the acquisition of the
assets, liabilities and operations of The Chinese
Bank in 2008, underlying assets rose by 22 per cent,
driven by growth in derivative assets.
The expansion in the Group’s balance sheet was
largely attributable to increases in derivative assets
and liabilities, and was due to growth in the fair
value of these positions rather than a rise in their
notional contract amounts. Excluding the growth in
derivative liabilities, customer accounts formed an
increasing share of the Group’s liabilities as
depositors and savers responded to HSBC’s
reputation for strength and security. As a result, a
proportion of the Group’s funding repayable on
demand or within one year rose. For information on
the Group’s management of liquidity, see pages
235 to 240.
The Group’s tier 1 capital ratio declined
from 9.3 per cent to 8.3 per cent. For detail on
regulatory capital and risk weighted assets, see
pages 274 to 280.
The following commentary is on an underlying
basis.
Assets
The Group’s cash and balances at central banks rose
substantially, particularly in Hong Kong as
additional liquidity was injected into the banking
system, and in the US where excess liquidity was
required in the short-term as part of a planned
transfer of assets between the Group’s subsidiaries.
Trading assets increased by 11 per cent. The
majority of the rise occurred on 30 September 2008,
following the Group’s consolidation of five Constant
Net Asset Value (‘CNAV’) funds with assets of
around US$40 billion. The decision to consolidate
these funds was based on actions taken to support
them. For further details of these actions, see
page 180. The rise was partly offset by the
reclassification of US$18 billion of trading assets