HSBC 2008 Annual Report Download - page 407
Download and view the complete annual report
Please find page 407 of the 2008 HSBC annual report below. You can navigate through the pages in the report by either clicking on the pages listed below, or by using the keyword search tool below to find specific information within the annual report.-
 1
1 -
2
-
3
-
4
-
5
-
6
-
7
-
8
-
9
-
10
-
11
-
12
-
13
-
14
-
15
-
16
-
17
-
18
-
19
-
20
-
21
-
22
-
23
-
24
-
25
-
26
-
27
-
28
-
29
-
30
-
31
-
32
-
33
-
34
-
35
-
36
-
37
-
38
-
39
-
40
-
41
-
42
-
43
-
44
-
45
-
46
-
47
-
48
-
49
-
50
-
51
-
52
-
53
-
54
-
55
-
56
-
57
-
58
-
59
-
60
-
61
-
62
-
63
-
64
-
65
-
66
-
67
-
68
-
69
-
70
-
71
-
72
-
73
-
74
-
75
-
76
-
77
-
78
-
79
-
80
-
81
-
82
-
83
-
84
-
85
-
86
-
87
-
88
-
89
-
90
-
91
-
92
-
93
-
94
-
95
-
96
-
97
-
98
-
99
-
100
-
101
-
102
-
103
-
104
-
105
-
106
-
107
-
108
-
109
-
110
-
111
-
112
-
113
-
114
-
115
-
116
-
117
-
118
-
119
-
120
-
121
-
122
-
123
-
124
-
125
-
126
-
127
-
128
-
129
-
130
-
131
-
132
-
133
-
134
-
135
-
136
-
137
-
138
-
139
-
140
-
141
-
142
-
143
-
144
-
145
-
146
-
147
-
148
-
149
-
150
-
151
-
152
-
153
-
154
-
155
-
156
-
157
-
158
-
159
-
160
-
161
-
162
-
163
-
164
-
165
-
166
-
167
-
168
-
169
-
170
-
171
-
172
-
173
-
174
-
175
-
176
-
177
-
178
-
179
-
180
-
181
-
182
-
183
-
184
-
185
-
186
-
187
-
188
-
189
-
190
-
191
-
192
-
193
-
194
-
195
-
196
-
197
-
198
-
199
-
200
-
201
-
202
-
203
-
204
-
205
-
206
-
207
-
208
-
209
-
210
-
211
-
212
-
213
-
214
-
215
-
216
-
217
-
218
-
219
-
220
-
221
-
222
-
223
-
224
-
225
-
226
-
227
-
228
-
229
-
230
-
231
-
232
-
233
-
234
-
235
-
236
-
237
-
238
-
239
-
240
-
241
-
242
-
243
-
244
-
245
-
246
-
247
-
248
-
249
-
250
-
251
-
252
-
253
-
254
-
255
-
256
-
257
-
258
-
259
-
260
-
261
-
262
-
263
-
264
-
265
-
266
-
267
-
268
-
269
-
270
-
271
-
272
-
273
-
274
-
275
-
276
-
277
-
278
-
279
-
280
-
281
-
282
-
283
-
284
-
285
-
286
-
287
-
288
-
289
-
290
-
291
-
292
-
293
-
294
-
295
-
296
-
297
-
298
-
299
-
300
-
301
-
302
-
303
-
304
-
305
-
306
-
307
-
308
-
309
-
310
-
311
-
312
-
313
-
314
-
315
-
316
-
317
-
318
-
319
-
320
-
321
-
322
-
323
-
324
-
325
-
326
-
327
-
328
-
329
-
330
-
331
-
332
-
333
-
334
-
335
-
336
-
337
-
338
-
339
-
340
-
341
-
342
-
343
-
344
-
345
-
346
-
347
-
348
-
349
-
350
-
351
-
352
-
353
-
354
-
355
-
356
-
357
-
358
-
359
-
360
-
361
-
362
-
363
-
364
-
365
-
366
-
367
-
368
-
369
-
370
-
371
-
372
-
373
-
374
-
375
-
376
-
377
-
378
-
379
-
380
-
381
-
382
-
383
-
384
-
385
-
386
-
387
-
388
-
389
-
390
-
391
-
392
-
393
-
394
-
395
-
396
-
 397
397 -
 398
398 -
 399
399 -
 400
400 -
 401
401 -
 402
402 -
 403
403 -
 404
404 -
 405
405 -
 406
406 -
 407
407 -
 408
408 -
 409
409 -
 410
410 -
 411
411 -
 412
412 -
 413
413 -
 414
414 -
 415
415 -
 416
416 -
 417
417 -
418
-
419
-
420
-
421
-
422
-
423
-
424
-
425
-
426
-
427
-
428
-
429
-
430
-
431
-
432
-
433
-
434
-
435
-
436
-
437
-
438
-
439
-
440
-
441
-
442
-
443
-
444
-
445
-
446
-
447
-
448
-
449
-
450
-
451
-
452
-
453
-
454
-
455
-
456
-
457
-
458
-
459
-
460
-
461
-
462
-
463
-
464
-
465
-
466
-
467
-
468
-
469
-
470
-
471
-
472
 |
 |

405
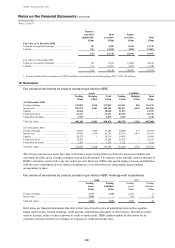
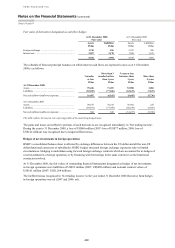
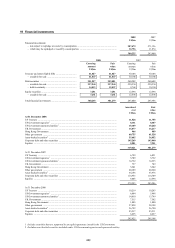
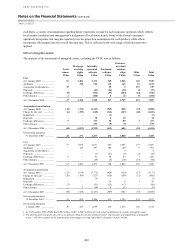
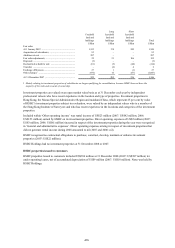
The following table provides an analysis of contractual maturities and weighted average yields of investment debt
securities as at 31 December 2008:
Within one year
After one year but
within five years
After five years but
within ten years After ten years
Amount Yield Amount Yield Amount Yield Amount Yield
US$m % US$m % US$m % US$m %
Available-for-sale
US Treasury ................................... 41 2.44 1,049 1.14 225 1.89 985 4.52
US Government agencies .............. – – 15 6.67 298 5.03 7,324 3.74
US Government-sponsored
agencies ..................................... 760 4.61
569 6.68
1,398 3.15
10,466 4.70
UK Government ............................. – – 446 2.47
– –
1,385 3.25
Hong Kong Government ............... 136 2.21 15 2.84 186 4.84
– –
Other governments ......................... 20,604 3.30 17,182 6.00 3,609 4.56 2,493 3.38
Asset-backed securities .................. 1,088 1.57 2,626 1.87 6,021 2.34 45,765 2.04
Corporate debt and other
securities .................................... 49,065 4.28
68,760 3.53
12,460 3.76
3,648 4.22
Total amortised cost ....................... 71,694 90,662 24,197 72,066
Total carrying value ....................... 71,967 89,931 22,402 53,644
Held-to-maturity
US Treasury ................................... – – 30 3.45 42 4.76 44 4.55
US Government agencies .............. – – – – 6 8.81 487 6.37
US Government-sponsored
agencies ..................................... – –
44 4.76
38 7.89
1,845 5.88
Hong Kong Government ............... 19 5.26 – – – –
– –
Other governments ......................... 148 4.73 149 4.70 301 4.32 532 6.58
Asset-backed securities .................. – – – – – – 185 5.95
Corporate debt and other
securities .................................... 417 3.84
3,670 4.28
5,352 4.58
704 4.83
Total amortised cost ....................... 584 3,893 5,739 3,797
Total carrying value ....................... 584 3,893 5,739 3,797
The maturity distributions of asset-backed securities are presented in the above table based upon contractual maturity
dates. The weighted average yield for each range of maturities in the above table is calculated by dividing the
annualised interest income for the year ended 31 December 2008 by the book amount of available-for-sale debt
securities at that date. The yields do not include the effect of related derivatives.
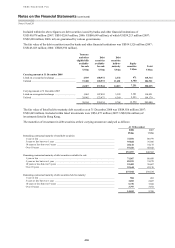
20 Transfers of financial assets not qualifying for de-recognition
HSBC enters into transactions in the normal course of business by which it transfers recognised financial assets
directly to third parties or to SPEs. These transfers may give rise to the full or partial derecognition of the financial
assets concerned.
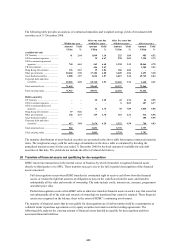
– Full derecognition occurs when HSBC transfers its contractual right to receive cash flows from the financial
assets, or retains the right but assumes an obligation to pass on the cash flows from the asset, and transfers
substantially all the risks and rewards of ownership. The risks include credit, interest rate, currency, prepayment
and other price risks.
– Partial derecognition occurs when HSBC sells or otherwise transfers financial assets in such a way that some but
not substantially all of the risks and rewards of ownership are transferred but control is retained. These financial
assets are recognised on the balance sheet to the extent of HSBC’s continuing involvement.
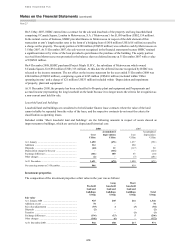
The majority of financial assets that do not qualify for derecognition are (i) debt securities held by counterparties as
collateral under repurchase agreements or (ii) equity securities lent under securities lending agreements. The
following table analyses the carrying amount of financial assets that did not qualify for derecognition and their
associated financial liabilities: