HSBC 2008 Annual Report Download - page 389
Download and view the complete annual report
Please find page 389 of the 2008 HSBC annual report below. You can navigate through the pages in the report by either clicking on the pages listed below, or by using the keyword search tool below to find specific information within the annual report.-
 1
1 -
2
-
3
-
4
-
5
-
6
-
7
-
8
-
9
-
10
-
11
-
12
-
13
-
14
-
15
-
16
-
17
-
18
-
19
-
20
-
21
-
22
-
23
-
24
-
25
-
26
-
27
-
28
-
29
-
30
-
31
-
32
-
33
-
34
-
35
-
36
-
37
-
38
-
39
-
40
-
41
-
42
-
43
-
44
-
45
-
46
-
47
-
48
-
49
-
50
-
51
-
52
-
53
-
54
-
55
-
56
-
57
-
58
-
59
-
60
-
61
-
62
-
63
-
64
-
65
-
66
-
67
-
68
-
69
-
70
-
71
-
72
-
73
-
74
-
75
-
76
-
77
-
78
-
79
-
80
-
81
-
82
-
83
-
84
-
85
-
86
-
87
-
88
-
89
-
90
-
91
-
92
-
93
-
94
-
95
-
96
-
97
-
98
-
99
-
100
-
101
-
102
-
103
-
104
-
105
-
106
-
107
-
108
-
109
-
110
-
111
-
112
-
113
-
114
-
115
-
116
-
117
-
118
-
119
-
120
-
121
-
122
-
123
-
124
-
125
-
126
-
127
-
128
-
129
-
130
-
131
-
132
-
133
-
134
-
135
-
136
-
137
-
138
-
139
-
140
-
141
-
142
-
143
-
144
-
145
-
146
-
147
-
148
-
149
-
150
-
151
-
152
-
153
-
154
-
155
-
156
-
157
-
158
-
159
-
160
-
161
-
162
-
163
-
164
-
165
-
166
-
167
-
168
-
169
-
170
-
171
-
172
-
173
-
174
-
175
-
176
-
177
-
178
-
179
-
180
-
181
-
182
-
183
-
184
-
185
-
186
-
187
-
188
-
189
-
190
-
191
-
192
-
193
-
194
-
195
-
196
-
197
-
198
-
199
-
200
-
201
-
202
-
203
-
204
-
205
-
206
-
207
-
208
-
209
-
210
-
211
-
212
-
213
-
214
-
215
-
216
-
217
-
218
-
219
-
220
-
221
-
222
-
223
-
224
-
225
-
226
-
227
-
228
-
229
-
230
-
231
-
232
-
233
-
234
-
235
-
236
-
237
-
238
-
239
-
240
-
241
-
242
-
243
-
244
-
245
-
246
-
247
-
248
-
249
-
250
-
251
-
252
-
253
-
254
-
255
-
256
-
257
-
258
-
259
-
260
-
261
-
262
-
263
-
264
-
265
-
266
-
267
-
268
-
269
-
270
-
271
-
272
-
273
-
274
-
275
-
276
-
277
-
278
-
279
-
280
-
281
-
282
-
283
-
284
-
285
-
286
-
287
-
288
-
289
-
290
-
291
-
292
-
293
-
294
-
295
-
296
-
297
-
298
-
299
-
300
-
301
-
302
-
303
-
304
-
305
-
306
-
307
-
308
-
309
-
310
-
311
-
312
-
313
-
314
-
315
-
316
-
317
-
318
-
319
-
320
-
321
-
322
-
323
-
324
-
325
-
326
-
327
-
328
-
329
-
330
-
331
-
332
-
333
-
334
-
335
-
336
-
337
-
338
-
339
-
340
-
341
-
342
-
343
-
344
-
345
-
346
-
347
-
348
-
349
-
350
-
351
-
352
-
353
-
354
-
355
-
356
-
357
-
358
-
359
-
360
-
361
-
362
-
363
-
364
-
365
-
366
-
367
-
368
-
369
-
370
-
371
-
372
-
373
-
374
-
375
-
376
-
377
-
378
-
 379
379 -
 380
380 -
 381
381 -
 382
382 -
 383
383 -
 384
384 -
 385
385 -
 386
386 -
 387
387 -
 388
388 -
 389
389 -
 390
390 -
 391
391 -
 392
392 -
 393
393 -
 394
394 -
 395
395 -
 396
396 -
 397
397 -
 398
398 -
 399
399 -
400
-
401
-
402
-
403
-
404
-
405
-
406
-
407
-
408
-
409
-
410
-
411
-
412
-
413
-
414
-
415
-
416
-
417
-
418
-
419
-
420
-
421
-
422
-
423
-
424
-
425
-
426
-
427
-
428
-
429
-
430
-
431
-
432
-
433
-
434
-
435
-
436
-
437
-
438
-
439
-
440
-
441
-
442
-
443
-
444
-
445
-
446
-
447
-
448
-
449
-
450
-
451
-
452
-
453
-
454
-
455
-
456
-
457
-
458
-
459
-
460
-
461
-
462
-
463
-
464
-
465
-
466
-
467
-
468
-
469
-
470
-
471
-
472
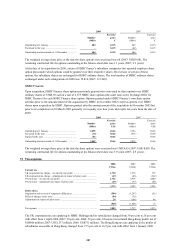
 |
 |

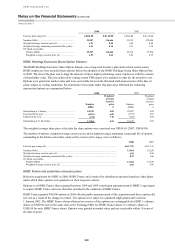
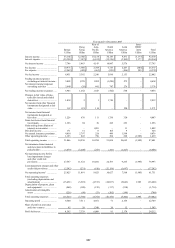
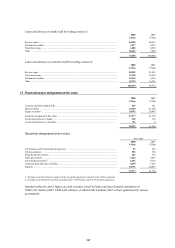
387
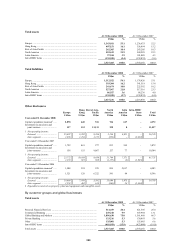
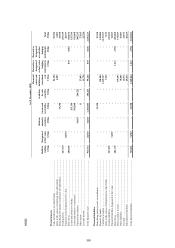
Year ended 31 December 2007
Europe
Hong
Kong
Rest of
Asia-
Pacific
North
America
Latin
America
Intra-
HSBC
items Total
US$m US$m US$m US$m US$m US$m US$m
Interest income ............................ 33,144 12,580 10,158 30,183 9,471 (3,177) 92,359
Interest expense .......................... (25,398) (7,097) (6,015) (15,336) (3,895) 3,177 (54,564)
Net interest income ..................... 7,746 5,483 4,143 14,847 5,576 – 37,795
Fee income .................................. 10,973 3,860 2,709 6,733 2,647 (585) 26,337
Fee expense ................................. (2,542) (498) (463) (923) (494) 585 (4,335)
Net fee income ............................ 8,431 3,362 2,246 5,810 2,153 – 22,002
Trading income/(expense)
excluding net interest income . 3,003 1,270 1,202 (1,289) 272 – 4,458
Net interest income/(expense)
on trading activities ................ 3,940 (28) 441 747 276 – 5,376
Net trading income/(expense) ..... 6,943 1,242 1,643 (542) 548 – 9,834
Changes in fair value of long-
term debt issued and related
derivatives ............................... 1,059 2 1 1,750 – – 2,812
Net income from other financial
instruments designated at fair
value ........................................ 167 674 110 – 320 – 1,271
Net income from financial
instruments designated at
fair value ................................. 1,226 676 111 1,750 320 – 4,083
Gains less losses from financial
investments ............................. 1,326 94 38 245 253 – 1,956
Gains arising from dilution of
interests in associates .............. – – 1,081 – 11 – 1,092
Dividend income ......................... 171 31 8 105 9 – 324
Net earned insurance premiums .. 4,010 2,797 226 449 1,594 – 9,076
Other operating income .............. 1,193 845 798 360 228 (1,985) 1,439
Total operating income ............... 31,046 14,530 10,294 23,024 10,692 (1,985) 87,601
Net insurance claims incurred
and movement in liabilities to
policyholders .......................... (3,479) (3,208) (253) (241) (1,427) – (8,608)
Net operating income before
loan impairment charges
and other credit risk
provisions ............................... 27,567 11,322 10,041 22,783 9,265 (1,985) 78,993
Loan impairment charges and othe
r
credit risk provisions .............. (2,542) (231) (616) (12,156) (1,697) – (17,242)
Net operating income1 ................ 25,025 11,091 9,425 10,627 7,568 (1,985) 61,751
Total operating expenses
(excluding depreciation and
amortisation) ........................... (15,451) (3,510) (4,572) (10,037) (5,043) 1,985 (36,628)
Depreciation of property, plant
and equipment ........................ (848) (180) (159) (317) (210) – (1,714)
Amortisation of intangible
assets ....................................... (226) (90) (33) (202) (149) – (700)
Total operating expenses ............ (16,525) (3,780) (4,764) (10,556) (5,402) 1,985 (39,042)
Operating profit .......................... 8,500 7,311 4,661 71 2,166 – 22,709
Share of profit in associates
and joint ventures ................... 95 28 1,348 20 12 – 1,503
Profit before tax .......................... 8,595 7,339 6,009 91 2,178 – 24,212