HSBC 2008 Annual Report Download - page 231
Download and view the complete annual report
Please find page 231 of the 2008 HSBC annual report below. You can navigate through the pages in the report by either clicking on the pages listed below, or by using the keyword search tool below to find specific information within the annual report.-
 1
1 -
2
-
3
-
4
-
5
-
6
-
7
-
8
-
9
-
10
-
11
-
12
-
13
-
14
-
15
-
16
-
17
-
18
-
19
-
20
-
21
-
22
-
23
-
24
-
25
-
26
-
27
-
28
-
29
-
30
-
31
-
32
-
33
-
34
-
35
-
36
-
37
-
38
-
39
-
40
-
41
-
42
-
43
-
44
-
45
-
46
-
47
-
48
-
49
-
50
-
51
-
52
-
53
-
54
-
55
-
56
-
57
-
58
-
59
-
60
-
61
-
62
-
63
-
64
-
65
-
66
-
67
-
68
-
69
-
70
-
71
-
72
-
73
-
74
-
75
-
76
-
77
-
78
-
79
-
80
-
81
-
82
-
83
-
84
-
85
-
86
-
87
-
88
-
89
-
90
-
91
-
92
-
93
-
94
-
95
-
96
-
97
-
98
-
99
-
100
-
101
-
102
-
103
-
104
-
105
-
106
-
107
-
108
-
109
-
110
-
111
-
112
-
113
-
114
-
115
-
116
-
117
-
118
-
119
-
120
-
121
-
122
-
123
-
124
-
125
-
126
-
127
-
128
-
129
-
130
-
131
-
132
-
133
-
134
-
135
-
136
-
137
-
138
-
139
-
140
-
141
-
142
-
143
-
144
-
145
-
146
-
147
-
148
-
149
-
150
-
151
-
152
-
153
-
154
-
155
-
156
-
157
-
158
-
159
-
160
-
161
-
162
-
163
-
164
-
165
-
166
-
167
-
168
-
169
-
170
-
171
-
172
-
173
-
174
-
175
-
176
-
177
-
178
-
179
-
180
-
181
-
182
-
183
-
184
-
185
-
186
-
187
-
188
-
189
-
190
-
191
-
192
-
193
-
194
-
195
-
196
-
197
-
198
-
199
-
200
-
201
-
202
-
203
-
204
-
205
-
206
-
207
-
208
-
209
-
210
-
211
-
212
-
213
-
214
-
215
-
216
-
217
-
218
-
219
-
220
-
 221
221 -
 222
222 -
 223
223 -
 224
224 -
 225
225 -
 226
226 -
 227
227 -
 228
228 -
 229
229 -
 230
230 -
 231
231 -
 232
232 -
 233
233 -
 234
234 -
 235
235 -
 236
236 -
 237
237 -
 238
238 -
 239
239 -
 240
240 -
 241
241 -
242
-
243
-
244
-
245
-
246
-
247
-
248
-
249
-
250
-
251
-
252
-
253
-
254
-
255
-
256
-
257
-
258
-
259
-
260
-
261
-
262
-
263
-
264
-
265
-
266
-
267
-
268
-
269
-
270
-
271
-
272
-
273
-
274
-
275
-
276
-
277
-
278
-
279
-
280
-
281
-
282
-
283
-
284
-
285
-
286
-
287
-
288
-
289
-
290
-
291
-
292
-
293
-
294
-
295
-
296
-
297
-
298
-
299
-
300
-
301
-
302
-
303
-
304
-
305
-
306
-
307
-
308
-
309
-
310
-
311
-
312
-
313
-
314
-
315
-
316
-
317
-
318
-
319
-
320
-
321
-
322
-
323
-
324
-
325
-
326
-
327
-
328
-
329
-
330
-
331
-
332
-
333
-
334
-
335
-
336
-
337
-
338
-
339
-
340
-
341
-
342
-
343
-
344
-
345
-
346
-
347
-
348
-
349
-
350
-
351
-
352
-
353
-
354
-
355
-
356
-
357
-
358
-
359
-
360
-
361
-
362
-
363
-
364
-
365
-
366
-
367
-
368
-
369
-
370
-
371
-
372
-
373
-
374
-
375
-
376
-
377
-
378
-
379
-
380
-
381
-
382
-
383
-
384
-
385
-
386
-
387
-
388
-
389
-
390
-
391
-
392
-
393
-
394
-
395
-
396
-
397
-
398
-
399
-
400
-
401
-
402
-
403
-
404
-
405
-
406
-
407
-
408
-
409
-
410
-
411
-
412
-
413
-
414
-
415
-
416
-
417
-
418
-
419
-
420
-
421
-
422
-
423
-
424
-
425
-
426
-
427
-
428
-
429
-
430
-
431
-
432
-
433
-
434
-
435
-
436
-
437
-
438
-
439
-
440
-
441
-
442
-
443
-
444
-
445
-
446
-
447
-
448
-
449
-
450
-
451
-
452
-
453
-
454
-
455
-
456
-
457
-
458
-
459
-
460
-
461
-
462
-
463
-
464
-
465
-
466
-
467
-
468
-
469
-
470
-
471
-
472
 |
 |

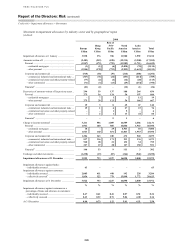
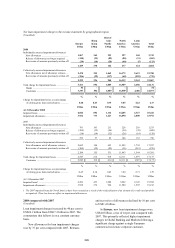
229
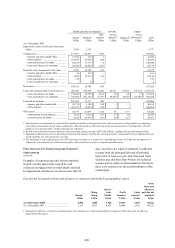
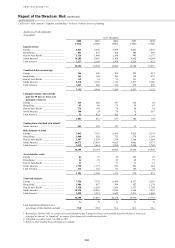
Net loan impairment charge to the income statement by geographical region
(Unaudited)
Europe
US$m
Hong
Kong
US$m
Rest of
Asia-
Pacific
US$m
North
America
US$m
Latin
America
US$m
Total
US$m
2008
Individually assessed impairment allowances
New allowances .............................................. 1,567 365 253 397 160 2,742
Release of allowances no longer required ..... (340) (25) (89) (80) (31) (565)
Recoveries of amounts previously written off (38) (10) (20) (40) (5) (113)
1,189 330 144 277 124 2,064
Collectively assessed impairment allowances
New allowances net of allowance releases .... 2,478 255 1,062 16,372 2,621 22,788
Recoveries of amounts previously written off (256) (29) (117) (60) (259) (721)
2,222 226 945 16,312 2,362 22,067
Total charge for impairment losses .................... 3,411 556 1,089 16,589 2,486 24,131
Banks ............................................................. 54 – – – – 54
Customers ...................................................... 3,357 556 1,089 16,589 2,486 24,077
% % % % % %
Charge for impairment losses as a percentage
of closing gross loans and advances .............. 0.68 0.43 0.75 5.85 4.22 2.17
US$m US$m US$m US$m US$m US$m
At 31 December 2008
Impaired loans .................................................... 6,844 852 1,114 14,285 2,327 25,422
Impairment allowances ....................................... 3,922 733 1,227 16,090 2,000 23,972
2007
Individually assessed impairment allowances
New allowances .............................................. 781 103 211 228 210 1,533
Release of allowances no longer required ..... (388) (32) (96) (54) (38) (608)
Recoveries of amounts previously written off (38) (14) (32) (26) (19) (129)
355 57 83 148 153 796
Collectively assessed impairment allowances
New allowances net of allowance releases .... 2,692 184 623 11,999 1,759 17,257
Recoveries of amounts previously written off (504) (29) (92) (36) (215) (876)
2,188 155 531 11,963 1,544 16,381
Total charge for impairment losses .................... 2,543 212 614 12,111 1,697 17,177
Customers ...................................................... 2,543 212 614 12,111 1,697 17,177
% % % % % %
Charge for impairment losses as a percentage
of closing gross loans and advances .............. 0.45 0.14 0.43 3.80 2.71 1.39
US$m US$m US$m US$m US$m US$m
At 31 December 2007
Impaired loans1 ................................................... 6,266 433 1,088 9,662 2,145 19,594
Impairment allowances ....................................... 3,938 376 926 11,980 1,992 19,212
1 The 2007 impaired loans for North America have been restated as a result of the reclassification of an element of a credit card portfolio
as impaired. There has been no effect on impairment allowances.
2008 compared with 2007
(Unaudited)
Loan impairment charges increased by 40 per cent to
US$24.1 billion from US$17.2 billion in 2007. The
commentary that follows is on a constant currency
basis.
New allowances for loan impairment charges
rose by 37 per cent compared with 2007. Releases
and recoveries of allowances declined by 10 per cent
to US$1.4 billion.
In Europe, new loan impairment charges were
US$4.0 billion, a rise of 24 per cent compared with
2007. This primarily reflected higher impairment
charges in Global Banking and Markets following a
significant charge against a single European
commercial real estate corporate customer.