HSBC 2008 Annual Report Download - page 391
Download and view the complete annual report
Please find page 391 of the 2008 HSBC annual report below. You can navigate through the pages in the report by either clicking on the pages listed below, or by using the keyword search tool below to find specific information within the annual report.-
 1
1 -
2
-
3
-
4
-
5
-
6
-
7
-
8
-
9
-
10
-
11
-
12
-
13
-
14
-
15
-
16
-
17
-
18
-
19
-
20
-
21
-
22
-
23
-
24
-
25
-
26
-
27
-
28
-
29
-
30
-
31
-
32
-
33
-
34
-
35
-
36
-
37
-
38
-
39
-
40
-
41
-
42
-
43
-
44
-
45
-
46
-
47
-
48
-
49
-
50
-
51
-
52
-
53
-
54
-
55
-
56
-
57
-
58
-
59
-
60
-
61
-
62
-
63
-
64
-
65
-
66
-
67
-
68
-
69
-
70
-
71
-
72
-
73
-
74
-
75
-
76
-
77
-
78
-
79
-
80
-
81
-
82
-
83
-
84
-
85
-
86
-
87
-
88
-
89
-
90
-
91
-
92
-
93
-
94
-
95
-
96
-
97
-
98
-
99
-
100
-
101
-
102
-
103
-
104
-
105
-
106
-
107
-
108
-
109
-
110
-
111
-
112
-
113
-
114
-
115
-
116
-
117
-
118
-
119
-
120
-
121
-
122
-
123
-
124
-
125
-
126
-
127
-
128
-
129
-
130
-
131
-
132
-
133
-
134
-
135
-
136
-
137
-
138
-
139
-
140
-
141
-
142
-
143
-
144
-
145
-
146
-
147
-
148
-
149
-
150
-
151
-
152
-
153
-
154
-
155
-
156
-
157
-
158
-
159
-
160
-
161
-
162
-
163
-
164
-
165
-
166
-
167
-
168
-
169
-
170
-
171
-
172
-
173
-
174
-
175
-
176
-
177
-
178
-
179
-
180
-
181
-
182
-
183
-
184
-
185
-
186
-
187
-
188
-
189
-
190
-
191
-
192
-
193
-
194
-
195
-
196
-
197
-
198
-
199
-
200
-
201
-
202
-
203
-
204
-
205
-
206
-
207
-
208
-
209
-
210
-
211
-
212
-
213
-
214
-
215
-
216
-
217
-
218
-
219
-
220
-
221
-
222
-
223
-
224
-
225
-
226
-
227
-
228
-
229
-
230
-
231
-
232
-
233
-
234
-
235
-
236
-
237
-
238
-
239
-
240
-
241
-
242
-
243
-
244
-
245
-
246
-
247
-
248
-
249
-
250
-
251
-
252
-
253
-
254
-
255
-
256
-
257
-
258
-
259
-
260
-
261
-
262
-
263
-
264
-
265
-
266
-
267
-
268
-
269
-
270
-
271
-
272
-
273
-
274
-
275
-
276
-
277
-
278
-
279
-
280
-
281
-
282
-
283
-
284
-
285
-
286
-
287
-
288
-
289
-
290
-
291
-
292
-
293
-
294
-
295
-
296
-
297
-
298
-
299
-
300
-
301
-
302
-
303
-
304
-
305
-
306
-
307
-
308
-
309
-
310
-
311
-
312
-
313
-
314
-
315
-
316
-
317
-
318
-
319
-
320
-
321
-
322
-
323
-
324
-
325
-
326
-
327
-
328
-
329
-
330
-
331
-
332
-
333
-
334
-
335
-
336
-
337
-
338
-
339
-
340
-
341
-
342
-
343
-
344
-
345
-
346
-
347
-
348
-
349
-
350
-
351
-
352
-
353
-
354
-
355
-
356
-
357
-
358
-
359
-
360
-
361
-
362
-
363
-
364
-
365
-
366
-
367
-
368
-
369
-
370
-
371
-
372
-
373
-
374
-
375
-
376
-
377
-
378
-
379
-
380
-
 381
381 -
 382
382 -
 383
383 -
 384
384 -
 385
385 -
 386
386 -
 387
387 -
 388
388 -
 389
389 -
 390
390 -
 391
391 -
 392
392 -
 393
393 -
 394
394 -
 395
395 -
 396
396 -
 397
397 -
 398
398 -
 399
399 -
 400
400 -
 401
401 -
402
-
403
-
404
-
405
-
406
-
407
-
408
-
409
-
410
-
411
-
412
-
413
-
414
-
415
-
416
-
417
-
418
-
419
-
420
-
421
-
422
-
423
-
424
-
425
-
426
-
427
-
428
-
429
-
430
-
431
-
432
-
433
-
434
-
435
-
436
-
437
-
438
-
439
-
440
-
441
-
442
-
443
-
444
-
445
-
446
-
447
-
448
-
449
-
450
-
451
-
452
-
453
-
454
-
455
-
456
-
457
-
458
-
459
-
460
-
461
-
462
-
463
-
464
-
465
-
466
-
467
-
468
-
469
-
470
-
471
-
472
 |
 |

389
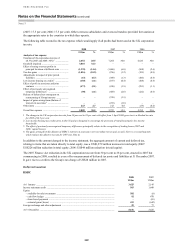
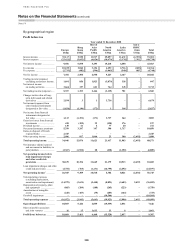
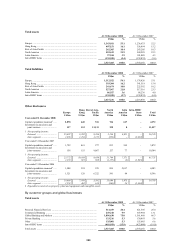
Total assets
At 31 December 2008 At 31 December 2007
US$m % US$m %
Europe .............................................................................................................. 1,343,011 53.1 1,236,633 52.5
Hong Kong ....................................................................................................... 407,151 16.1 356,894 15.2
Rest of Asia-Pacific ......................................................................................... 262,305 10.4 243,205 10.3
North America ................................................................................................. 552,612 21.9 549,285 23.3
Latin America .................................................................................................. 97,944 3.9 101,088 4.3
Intra-HSBC items ............................................................................................ (135,558) (5.4) (132,839) (5.6)
2,527,465 100.0 2,354,266 100.0
Total liabilities
At 31 December 2008 At 31 December 2007
US$m % US$m %
Europe .............................................................................................................. 1,312,922 54.1 1,178,826 53.1
Hong Kong ....................................................................................................... 393,304 16.2 341,519 15.4
Rest of Asia-Pacific ......................................................................................... 241,674 10.0 225,592 10.2
North America ................................................................................................. 527,967 21.8 517,516 23.3
Latin America .................................................................................................. 86,927 3.6 88,236 4.0
Intra-HSBC items ............................................................................................ (135,558) (5.7) (132,839) (6.0)
2,427,236 100.0 2,218,850 100.0
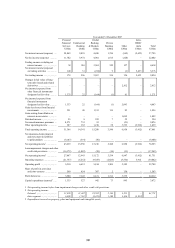
Other disclosures
Europe
Hong
Kong
Rest of Asia-
Pacific
North
America
Latin
America
Intra-HSBC
items Total
US$m US$m US$m US$m US$m US$m US$m
Year ended 31 December 2008
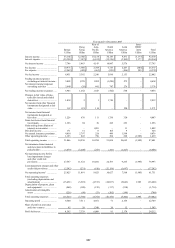
Capital expenditure incurred2 ..... 2,078 440 511 726 617 – 4,372
Investment in associates and
joint ventures .......................... 137 153 11,111 128 8 – 11,537
1 Net operating income:
External .................................. 25,887 8,205 9,396 5,236 8,021 – 56,745
Inter-segment .......................... 1,038 1,184 1,122 (852) – (2,492) –
Year ended 31 December 2007
Capital expenditure incurred2 ..... 1,722 441 277 833 599 – 3,872
Investment in associates and
joint ventures .......................... 158 155 9,867 127 77 – 10,384
1 Net operating income:
External .................................. 23,772 10,168 8,456 11,784 7,571 – 61,751
Inter-segment .......................... 1,253 923 969 (1,157) (3) (1,985) –
Year ended 31 December 2006
Capital expenditure incurred2 ..... 1,508 324 235 899 2,017 – 4,983
Investment in associates and
joint ventures .......................... 1,321 128 6,322 541 84 – 8,396
1 Net operating income:
External .................................. 19,664 7,970 5,592 15,694 5,873 – 54,793
Inter-segment .......................... 1,253 462 618 (863) 24 (1,494) –
2 Expenditure incurred on property, plant and equipment and intangible assets
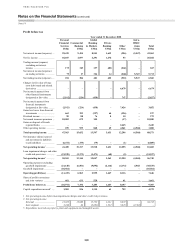
By customer groups and global businesses
Total assets
At 31 December 2008 At 31 December 2007
US$m % US$m %
Personal Financial Services ............................................................................. 514,419 20.4 621,356 26.4
Commercial Banking ....................................................................................... 249,218 9.9 307,944 13.1
Global Banking and Markets ........................................................................... 1,896,630 75.0 1,561,468 66.3
Private Banking ............................................................................................... 133,216 5.3 130,893 5.6
Other ................................................................................................................ 135,001 5.3 155,685 6.6
Intra-HSBC items ............................................................................................ (401,019) (15.9) (423,080) (18.0)
Total assets ....................................................................................................... 2,527,465 100.0 2,354,266 100.0