HSBC 2008 Annual Report Download - page 114
Download and view the complete annual report
Please find page 114 of the 2008 HSBC annual report below. You can navigate through the pages in the report by either clicking on the pages listed below, or by using the keyword search tool below to find specific information within the annual report.-
 1
1 -
2
-
3
-
4
-
5
-
6
-
7
-
8
-
9
-
10
-
11
-
12
-
13
-
14
-
15
-
16
-
17
-
18
-
19
-
20
-
21
-
22
-
23
-
24
-
25
-
26
-
27
-
28
-
29
-
30
-
31
-
32
-
33
-
34
-
35
-
36
-
37
-
38
-
39
-
40
-
41
-
42
-
43
-
44
-
45
-
46
-
47
-
48
-
49
-
50
-
51
-
52
-
53
-
54
-
55
-
56
-
57
-
58
-
59
-
60
-
61
-
62
-
63
-
64
-
65
-
66
-
67
-
68
-
69
-
70
-
71
-
72
-
73
-
74
-
75
-
76
-
77
-
78
-
79
-
80
-
81
-
82
-
83
-
84
-
85
-
86
-
87
-
88
-
89
-
90
-
91
-
92
-
93
-
94
-
95
-
96
-
97
-
98
-
99
-
100
-
101
-
102
-
103
-
 104
104 -
 105
105 -
 106
106 -
 107
107 -
 108
108 -
 109
109 -
 110
110 -
 111
111 -
 112
112 -
 113
113 -
 114
114 -
 115
115 -
 116
116 -
 117
117 -
 118
118 -
 119
119 -
 120
120 -
 121
121 -
 122
122 -
 123
123 -
 124
124 -
125
-
126
-
127
-
128
-
129
-
130
-
131
-
132
-
133
-
134
-
135
-
136
-
137
-
138
-
139
-
140
-
141
-
142
-
143
-
144
-
145
-
146
-
147
-
148
-
149
-
150
-
151
-
152
-
153
-
154
-
155
-
156
-
157
-
158
-
159
-
160
-
161
-
162
-
163
-
164
-
165
-
166
-
167
-
168
-
169
-
170
-
171
-
172
-
173
-
174
-
175
-
176
-
177
-
178
-
179
-
180
-
181
-
182
-
183
-
184
-
185
-
186
-
187
-
188
-
189
-
190
-
191
-
192
-
193
-
194
-
195
-
196
-
197
-
198
-
199
-
200
-
201
-
202
-
203
-
204
-
205
-
206
-
207
-
208
-
209
-
210
-
211
-
212
-
213
-
214
-
215
-
216
-
217
-
218
-
219
-
220
-
221
-
222
-
223
-
224
-
225
-
226
-
227
-
228
-
229
-
230
-
231
-
232
-
233
-
234
-
235
-
236
-
237
-
238
-
239
-
240
-
241
-
242
-
243
-
244
-
245
-
246
-
247
-
248
-
249
-
250
-
251
-
252
-
253
-
254
-
255
-
256
-
257
-
258
-
259
-
260
-
261
-
262
-
263
-
264
-
265
-
266
-
267
-
268
-
269
-
270
-
271
-
272
-
273
-
274
-
275
-
276
-
277
-
278
-
279
-
280
-
281
-
282
-
283
-
284
-
285
-
286
-
287
-
288
-
289
-
290
-
291
-
292
-
293
-
294
-
295
-
296
-
297
-
298
-
299
-
300
-
301
-
302
-
303
-
304
-
305
-
306
-
307
-
308
-
309
-
310
-
311
-
312
-
313
-
314
-
315
-
316
-
317
-
318
-
319
-
320
-
321
-
322
-
323
-
324
-
325
-
326
-
327
-
328
-
329
-
330
-
331
-
332
-
333
-
334
-
335
-
336
-
337
-
338
-
339
-
340
-
341
-
342
-
343
-
344
-
345
-
346
-
347
-
348
-
349
-
350
-
351
-
352
-
353
-
354
-
355
-
356
-
357
-
358
-
359
-
360
-
361
-
362
-
363
-
364
-
365
-
366
-
367
-
368
-
369
-
370
-
371
-
372
-
373
-
374
-
375
-
376
-
377
-
378
-
379
-
380
-
381
-
382
-
383
-
384
-
385
-
386
-
387
-
388
-
389
-
390
-
391
-
392
-
393
-
394
-
395
-
396
-
397
-
398
-
399
-
400
-
401
-
402
-
403
-
404
-
405
-
406
-
407
-
408
-
409
-
410
-
411
-
412
-
413
-
414
-
415
-
416
-
417
-
418
-
419
-
420
-
421
-
422
-
423
-
424
-
425
-
426
-
427
-
428
-
429
-
430
-
431
-
432
-
433
-
434
-
435
-
436
-
437
-
438
-
439
-
440
-
441
-
442
-
443
-
444
-
445
-
446
-
447
-
448
-
449
-
450
-
451
-
452
-
453
-
454
-
455
-
456
-
457
-
458
-
459
-
460
-
461
-
462
-
463
-
464
-
465
-
466
-
467
-
468
-
469
-
470
-
471
-
472
 |
 |

HSBC HOLDINGS PLC
Report of the Directors: Operating and Financial Review (continued)
Geographical regions > Rest of Asia-Pacific > 2008 / 2007
112
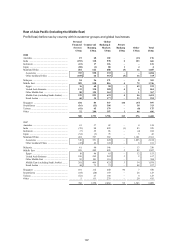
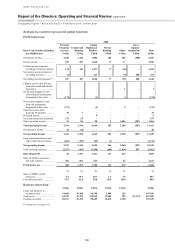
There was strong growth in net interest income
from Balance Sheet Management within Global
Banking and Markets, due to lower funding costs
and steeper yield curves, notably in Singapore,
mainland China, India, Japan and the Middle East.
Net fee income rose by 13 per cent, driven by a
growth in fees from personal credit cards and trade
and supply chain services. Credit card fees rose,
particularly in the Middle East and India, driven by
increases in interchange fees from higher cardholder
spending and late payment and over-limit fees from
higher delinquencies (see below). Trade and supply
chain services contributed strongly to fee income
growth with an increase of 34 per cent in the Middle
East, in part reflecting the significant rise in
commodity prices in the first half of the year,
demonstrably in the construction and infrastructure
industries in the UAE. There were lower fees from
investment products and broking across the region,
driven by a decline in equity markets and weakened
investor sentiment.
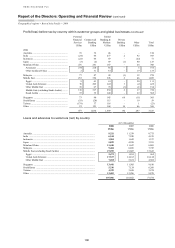
Fee income from credit facilities rose, notably in
the Middle East, India, Australia and Singapore,
reflecting increases in the number of customers.
Net trading income rose by 51 per cent,
predominantly due to strong Rates and foreign
exchange trading across the region as volatile market
conditions continued, encouraging increased
corporate hedging activity.
Growth was particularly strong in South Korea,
mainland China and Australia due to strategic
positioning of HSBC’s balance sheet to benefit from
the interest rate cuts and foreign exchange volatility
in 2008, and increased activity in these local
markets. In the Middle East, market uncertainty
regarding possible currency revaluations drove
volatility and, together with robust client demand,
led to growth in foreign exchange income. In India,
foreign exchange and, to a lesser extent, Rates
revenues rose, driven mainly by increased customer
activity and high levels of market volatility.
A net loss from financial instruments designated
at fair value of US$171 million was recorded
compared with income of US$111 million in 2007.
Declines in equity markets affected unit-linked
insurance products, particularly in Singapore. This
was largely offset by a corresponding decrease in
liabilities to policyholders reflected in net insurance
claims incurred and movement in liabilities to
policyholders.
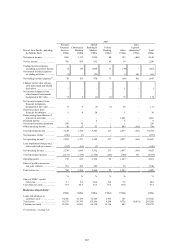
Net earned insurance premiums decreased by
17 per cent to US$197 million, mainly in Singapore
and Malaysia due to lower sales of single premium
unit-linked products. This was partly offset by an
increase in the sale of general insurance products.
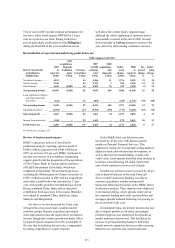
Loan impairment charges rose sharply,
increasing by 88 per cent to US$1.1 billion,
following a marked deterioration in credit quality
across the region in the final quarter of the year.
These charges rose most significantly in India, the
Middle East and, to a lesser extent, in Australia.
In India, the rise was attributable to increased
delinquency across personal lending portfolios, in
response to which HSBC took action to restrict
mortgage and personal lending. However, HSBC
continued to extend credit to selected cards
customers, which resulted in volume growth and
also contributed to higher loan impairment charges.
In the Middle East, higher loan impairment
charges were the result of volume growth and
increased delinquency rates on personal lending.
In Australia, higher delinquencies arose from the
maturing of the cards portfolio and, to a lesser
extent, volume growth, in addition to a credit risk
provision related to an exposure to an Icelandic
Bank. Partly offsetting this, loan impairment charges
declined by 41 per cent in Taiwan due to an
improvement in asset quality. Similarly, in Thailand,
loan impairment charges were 69 per cent lower due
to the non-recurrence of charges attributable to the
down-grading of certain corporate customers.
Operating expenses increased by 16 per cent to
US$5.7 billion. Significant investment in the region
continued, notably in mainland China where 29 new
outlets were opened and staff numbers increased.
Related premises and equipment costs rose
accordingly. Expansion was also pursued in
Indonesia with the addition of new branches, and in
Japan with the rollout of seven HSBC Premier
centres. In the Middle East, operating expenses were
22 per cent higher in line with substantially
increased levels of operating volumes and related
headcount growth. In India, the rise in operating
expenses was driven mainly by investment in IT,
premises costs and an increase in collection activities
as default rates rose. Business growth contributed to
higher operating expenses in Australia. Litigation
costs in the region rose.