HSBC 2008 Annual Report Download - page 179
Download and view the complete annual report
Please find page 179 of the 2008 HSBC annual report below. You can navigate through the pages in the report by either clicking on the pages listed below, or by using the keyword search tool below to find specific information within the annual report.-
 1
1 -
2
-
3
-
4
-
5
-
6
-
7
-
8
-
9
-
10
-
11
-
12
-
13
-
14
-
15
-
16
-
17
-
18
-
19
-
20
-
21
-
22
-
23
-
24
-
25
-
26
-
27
-
28
-
29
-
30
-
31
-
32
-
33
-
34
-
35
-
36
-
37
-
38
-
39
-
40
-
41
-
42
-
43
-
44
-
45
-
46
-
47
-
48
-
49
-
50
-
51
-
52
-
53
-
54
-
55
-
56
-
57
-
58
-
59
-
60
-
61
-
62
-
63
-
64
-
65
-
66
-
67
-
68
-
69
-
70
-
71
-
72
-
73
-
74
-
75
-
76
-
77
-
78
-
79
-
80
-
81
-
82
-
83
-
84
-
85
-
86
-
87
-
88
-
89
-
90
-
91
-
92
-
93
-
94
-
95
-
96
-
97
-
98
-
99
-
100
-
101
-
102
-
103
-
104
-
105
-
106
-
107
-
108
-
109
-
110
-
111
-
112
-
113
-
114
-
115
-
116
-
117
-
118
-
119
-
120
-
121
-
122
-
123
-
124
-
125
-
126
-
127
-
128
-
129
-
130
-
131
-
132
-
133
-
134
-
135
-
136
-
137
-
138
-
139
-
140
-
141
-
142
-
143
-
144
-
145
-
146
-
147
-
148
-
149
-
150
-
151
-
152
-
153
-
154
-
155
-
156
-
157
-
158
-
159
-
160
-
161
-
162
-
163
-
164
-
165
-
166
-
167
-
168
-
 169
169 -
 170
170 -
 171
171 -
 172
172 -
 173
173 -
 174
174 -
 175
175 -
 176
176 -
 177
177 -
 178
178 -
 179
179 -
 180
180 -
 181
181 -
 182
182 -
 183
183 -
 184
184 -
 185
185 -
 186
186 -
 187
187 -
 188
188 -
 189
189 -
190
-
191
-
192
-
193
-
194
-
195
-
196
-
197
-
198
-
199
-
200
-
201
-
202
-
203
-
204
-
205
-
206
-
207
-
208
-
209
-
210
-
211
-
212
-
213
-
214
-
215
-
216
-
217
-
218
-
219
-
220
-
221
-
222
-
223
-
224
-
225
-
226
-
227
-
228
-
229
-
230
-
231
-
232
-
233
-
234
-
235
-
236
-
237
-
238
-
239
-
240
-
241
-
242
-
243
-
244
-
245
-
246
-
247
-
248
-
249
-
250
-
251
-
252
-
253
-
254
-
255
-
256
-
257
-
258
-
259
-
260
-
261
-
262
-
263
-
264
-
265
-
266
-
267
-
268
-
269
-
270
-
271
-
272
-
273
-
274
-
275
-
276
-
277
-
278
-
279
-
280
-
281
-
282
-
283
-
284
-
285
-
286
-
287
-
288
-
289
-
290
-
291
-
292
-
293
-
294
-
295
-
296
-
297
-
298
-
299
-
300
-
301
-
302
-
303
-
304
-
305
-
306
-
307
-
308
-
309
-
310
-
311
-
312
-
313
-
314
-
315
-
316
-
317
-
318
-
319
-
320
-
321
-
322
-
323
-
324
-
325
-
326
-
327
-
328
-
329
-
330
-
331
-
332
-
333
-
334
-
335
-
336
-
337
-
338
-
339
-
340
-
341
-
342
-
343
-
344
-
345
-
346
-
347
-
348
-
349
-
350
-
351
-
352
-
353
-
354
-
355
-
356
-
357
-
358
-
359
-
360
-
361
-
362
-
363
-
364
-
365
-
366
-
367
-
368
-
369
-
370
-
371
-
372
-
373
-
374
-
375
-
376
-
377
-
378
-
379
-
380
-
381
-
382
-
383
-
384
-
385
-
386
-
387
-
388
-
389
-
390
-
391
-
392
-
393
-
394
-
395
-
396
-
397
-
398
-
399
-
400
-
401
-
402
-
403
-
404
-
405
-
406
-
407
-
408
-
409
-
410
-
411
-
412
-
413
-
414
-
415
-
416
-
417
-
418
-
419
-
420
-
421
-
422
-
423
-
424
-
425
-
426
-
427
-
428
-
429
-
430
-
431
-
432
-
433
-
434
-
435
-
436
-
437
-
438
-
439
-
440
-
441
-
442
-
443
-
444
-
445
-
446
-
447
-
448
-
449
-
450
-
451
-
452
-
453
-
454
-
455
-
456
-
457
-
458
-
459
-
460
-
461
-
462
-
463
-
464
-
465
-
466
-
467
-
468
-
469
-
470
-
471
-
472
 |
 |

177
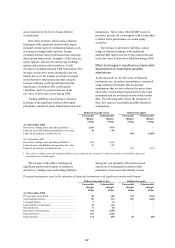
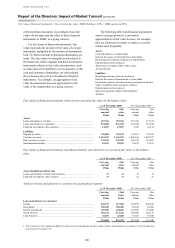
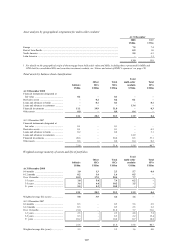
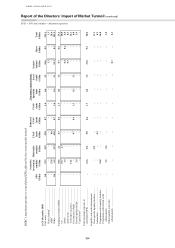
Asset analysis by geographical origination for multi-seller conduits1
At 31 December
2008 2007
US$bn US$bn
Europe ...................................................................................................................................................... 7.5 7.4
Rest of Asia-Pacific ................................................................................................................................. 0.9 1.0
North America ......................................................................................................................................... 5.5 6.3
Latin America .......................................................................................................................................... – 1.1
13.9 15.8
1 For details on the geographical origin of the mortgage loans held at fair value and ABSs, including those represented by MBSs and
CDOs held in consolidated SIVs and securities investment conduits, see ‘Nature and extent of HSBC’s exposures’ on page 150.
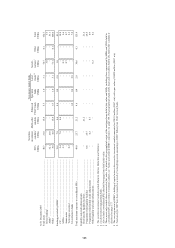
Total assets by balance sheet classification
Solitaire
Other
SICs
Total
SICs
Total
multi-seller
conduits
Total
SIVs
US$bn
US$bn US$bn
US$bn
US$bn
At 31 December 2008
Financial instruments designated at
fair value ................................................ 0.1 – 0.1 – –
Derivative assets ....................................... – 0.2 0.2 0.1 –
Loans and advances to banks ................... – 0.1 0.1 – 0.1
Loans and advances to customers ............ – – – 13.4 –
Financial investments ............................... 11.1 19.9 31.0 – 0.3
Other assets ............................................... 0.9 – 0.9 0.4 –
12.1 20.2 32.3 13.9 0.4
At 31 December 2007
Financial instruments designated at
fair value ................................................ 0.1 – 0.1 – –
Derivative assets ....................................... 0.1 – 0.1 – 0.3
Loans and advances to banks ................... 0.2 – 0.2 – 3.1
Loans and advances to customers ............ – – – 14.9 –
Financial investments ............................... 20.6 – 20.6 0.5 37.1
Other assets ............................................... 0.6 – 0.6 0.4 0.2
21.6 – 21.6 15.8 40.7
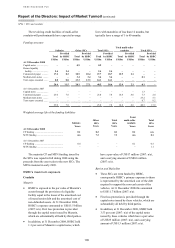
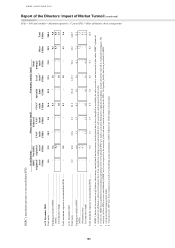
Weighted average maturity of assets and life of portfolios
Solitaire
Other
SICs
Total
SICs
Total
multi-seller
conduits
Total
SIVs
US$bn
US$bn US$bn
US$bn
US$bn
At 31 December 2008
0-6 months ................................................ 1.0 1.3 2.3 5.7 0.4
6-12 months .............................................. 0.2 1.4 1.6 0.5 –
Over 12 months ........................................ 10.9 17.5 28.4 7.7 –
1-3 years ................................................. 1.8 5.6 7.4 6.2 –
3-5 years ................................................. 3.6 6.6 10.2 1.5 –
5+ years .................................................. 5.5 5.3 10.8 – –
12.1 20.2 32.3 13.9 0.4
Weighted average life (years) ................... 5.8 3.9 4.6 1.6 –
At 31 December 2007
0-6 months ................................................ 0.3 – 0.3 5.6 6.9
6-12 months .............................................. 0.3 – 0.3 2.5 2.2
Over 12 months ........................................ 21.0 – 21.0 7.7 31.6
1-3 years ................................................. 2.5 – 2.5 4.8 7.6
3-5 years ................................................. 8.3 – 8.3 2.2 13.4
5+ years .................................................. 10.2 – 10.2 0.7 10.6
21.6 – 21.6 15.8 40.7
Weighted average life (years) ................... 5.3 – 5.3 1.6 4.0