HSBC 2008 Annual Report Download - page 112
Download and view the complete annual report
Please find page 112 of the 2008 HSBC annual report below. You can navigate through the pages in the report by either clicking on the pages listed below, or by using the keyword search tool below to find specific information within the annual report.-
 1
1 -
2
-
3
-
4
-
5
-
6
-
7
-
8
-
9
-
10
-
11
-
12
-
13
-
14
-
15
-
16
-
17
-
18
-
19
-
20
-
21
-
22
-
23
-
24
-
25
-
26
-
27
-
28
-
29
-
30
-
31
-
32
-
33
-
34
-
35
-
36
-
37
-
38
-
39
-
40
-
41
-
42
-
43
-
44
-
45
-
46
-
47
-
48
-
49
-
50
-
51
-
52
-
53
-
54
-
55
-
56
-
57
-
58
-
59
-
60
-
61
-
62
-
63
-
64
-
65
-
66
-
67
-
68
-
69
-
70
-
71
-
72
-
73
-
74
-
75
-
76
-
77
-
78
-
79
-
80
-
81
-
82
-
83
-
84
-
85
-
86
-
87
-
88
-
89
-
90
-
91
-
92
-
93
-
94
-
95
-
96
-
97
-
98
-
99
-
100
-
101
-
 102
102 -
 103
103 -
 104
104 -
 105
105 -
 106
106 -
 107
107 -
 108
108 -
 109
109 -
 110
110 -
 111
111 -
 112
112 -
 113
113 -
 114
114 -
 115
115 -
 116
116 -
 117
117 -
 118
118 -
 119
119 -
 120
120 -
 121
121 -
 122
122 -
123
-
124
-
125
-
126
-
127
-
128
-
129
-
130
-
131
-
132
-
133
-
134
-
135
-
136
-
137
-
138
-
139
-
140
-
141
-
142
-
143
-
144
-
145
-
146
-
147
-
148
-
149
-
150
-
151
-
152
-
153
-
154
-
155
-
156
-
157
-
158
-
159
-
160
-
161
-
162
-
163
-
164
-
165
-
166
-
167
-
168
-
169
-
170
-
171
-
172
-
173
-
174
-
175
-
176
-
177
-
178
-
179
-
180
-
181
-
182
-
183
-
184
-
185
-
186
-
187
-
188
-
189
-
190
-
191
-
192
-
193
-
194
-
195
-
196
-
197
-
198
-
199
-
200
-
201
-
202
-
203
-
204
-
205
-
206
-
207
-
208
-
209
-
210
-
211
-
212
-
213
-
214
-
215
-
216
-
217
-
218
-
219
-
220
-
221
-
222
-
223
-
224
-
225
-
226
-
227
-
228
-
229
-
230
-
231
-
232
-
233
-
234
-
235
-
236
-
237
-
238
-
239
-
240
-
241
-
242
-
243
-
244
-
245
-
246
-
247
-
248
-
249
-
250
-
251
-
252
-
253
-
254
-
255
-
256
-
257
-
258
-
259
-
260
-
261
-
262
-
263
-
264
-
265
-
266
-
267
-
268
-
269
-
270
-
271
-
272
-
273
-
274
-
275
-
276
-
277
-
278
-
279
-
280
-
281
-
282
-
283
-
284
-
285
-
286
-
287
-
288
-
289
-
290
-
291
-
292
-
293
-
294
-
295
-
296
-
297
-
298
-
299
-
300
-
301
-
302
-
303
-
304
-
305
-
306
-
307
-
308
-
309
-
310
-
311
-
312
-
313
-
314
-
315
-
316
-
317
-
318
-
319
-
320
-
321
-
322
-
323
-
324
-
325
-
326
-
327
-
328
-
329
-
330
-
331
-
332
-
333
-
334
-
335
-
336
-
337
-
338
-
339
-
340
-
341
-
342
-
343
-
344
-
345
-
346
-
347
-
348
-
349
-
350
-
351
-
352
-
353
-
354
-
355
-
356
-
357
-
358
-
359
-
360
-
361
-
362
-
363
-
364
-
365
-
366
-
367
-
368
-
369
-
370
-
371
-
372
-
373
-
374
-
375
-
376
-
377
-
378
-
379
-
380
-
381
-
382
-
383
-
384
-
385
-
386
-
387
-
388
-
389
-
390
-
391
-
392
-
393
-
394
-
395
-
396
-
397
-
398
-
399
-
400
-
401
-
402
-
403
-
404
-
405
-
406
-
407
-
408
-
409
-
410
-
411
-
412
-
413
-
414
-
415
-
416
-
417
-
418
-
419
-
420
-
421
-
422
-
423
-
424
-
425
-
426
-
427
-
428
-
429
-
430
-
431
-
432
-
433
-
434
-
435
-
436
-
437
-
438
-
439
-
440
-
441
-
442
-
443
-
444
-
445
-
446
-
447
-
448
-
449
-
450
-
451
-
452
-
453
-
454
-
455
-
456
-
457
-
458
-
459
-
460
-
461
-
462
-
463
-
464
-
465
-
466
-
467
-
468
-
469
-
470
-
471
-
472
 |
 |

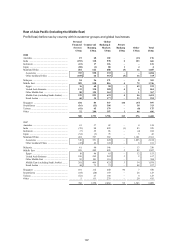
HSBC HOLDINGS PLC
Report of the Directors: Operating and Financial Review (continued)
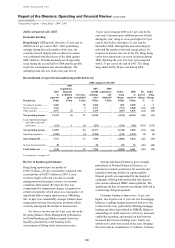
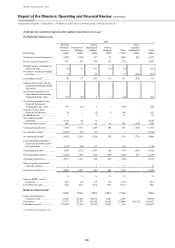
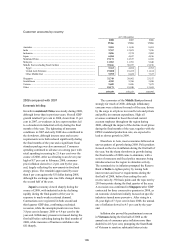
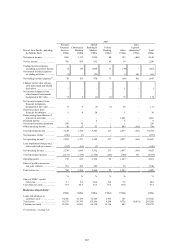
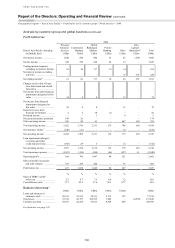
Geographical regions > Rest of Asia-Pacific > 2008
110
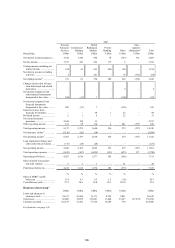
Profit before tax
2008 2007 2006
Rest of Asia-Pacific (including the Middle East) US$m US$m US$m
Net interest income .......................................................................................... 5,493 4,143 3,047
Net fee income ................................................................................................. 2,558 2,246 1,622
Net trading income .......................................................................................... 2,444 1,643 1,181
Changes in fair value of long-term debt issued and related derivatives ......... 11 –
Net income/(expense) from other financial instruments designated at
fair value ..................................................................................................... (172) 110 79
Net income/(expense) from financial instruments designated at
fair value ..................................................................................................... (171) 111 79
Gains less losses from financial investments .................................................. 32 38 41
Gains arising from dilution of interests in associates ..................................... – 1,081 –
Dividend income .............................................................................................. 4 8 5
Net earned insurance premiums ...................................................................... 197 226 174
Other operating income ................................................................................... 1,064 798 765
Total operating income ................................................................................. 11,621 10,294 6,914
Net insurance claims incurred and movement in liabilities
to policyholders .......................................................................................... 28 (253) (192)
Net operating income before loan impairment charges and other
credit risk provisions ................................................................................ 11,649 10,041 6,722
Loan impairment charges and other credit risk provisions ............................. (1,131) (616) (512)
Net operating income .................................................................................... 10,518 9,425 6,210
Total operating expenses ................................................................................. (5,663) (4,764) (3,548)
Operating profit ............................................................................................. 4,855 4,661 2,662
Share of profit in associates and joint ventures ............................................... 1,613 1,348 865
Profit before tax ............................................................................................. 6,468 6,009 3,527
% % %
Share of HSBC’s profit before tax .................................................................. 69.5 24.8 16.0
Cost efficiency ratio ........................................................................................ 48.6 47.4 52.8
Year-end staff numbers (full-time equivalent) ................................................ 98,159 88,573 72,265
Balance sheet data15
At 31 December
2008
US$m
2007
US$m
2006
US$m
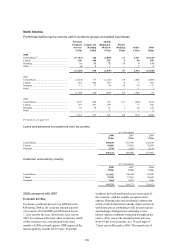
Loans and advances to customers (net) ........................................................... 107,956 101,852 77,574
Loans and advances to banks (net) .................................................................. 36,141 39,861 27,517
Trading assets, financial assets designated at fair value, and
financial investments ................................................................................... 61,223
64,381 41,585
Total assets ...................................................................................................... 262,305 243,205 175,010
Deposits by banks ............................................................................................ 13,689 17,560 10,323
Customer accounts ........................................................................................... 159,359 150,233 108,995
For footnote, see page 143.
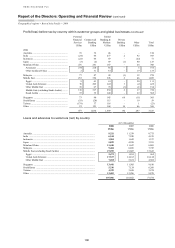
All commentaries on Rest of Asia-Pacific are on an underlying basis unless stated otherwise.
increases, before these measures were rapidly
reversed during the final months of the year. Interest
rate increases were also forthcoming in Indonesia
between May and October 2008, although with
growth levels maintaining a relatively robust level
during much of the year, a tentative easing cycle was
only initiated during the final weeks of 2008. Bank
Negara Malaysia proved the exception by refraining
from interest rate increases during the year, even as
consumer price inflation accelerated to 8.5 per cent
in July 2008, before cutting the policy rate to
3.25 per cent in November. The outlook for the
South Korean economy was affected by the open
nature of the economy and the relatively high levels
of household and corporate sector indebtedness. Full
year GDP rose by 2.5 per cent in 2008, down from