HSBC 2008 Annual Report Download - page 274
Download and view the complete annual report
Please find page 274 of the 2008 HSBC annual report below. You can navigate through the pages in the report by either clicking on the pages listed below, or by using the keyword search tool below to find specific information within the annual report.-
 1
1 -
2
-
3
-
4
-
5
-
6
-
7
-
8
-
9
-
10
-
11
-
12
-
13
-
14
-
15
-
16
-
17
-
18
-
19
-
20
-
21
-
22
-
23
-
24
-
25
-
26
-
27
-
28
-
29
-
30
-
31
-
32
-
33
-
34
-
35
-
36
-
37
-
38
-
39
-
40
-
41
-
42
-
43
-
44
-
45
-
46
-
47
-
48
-
49
-
50
-
51
-
52
-
53
-
54
-
55
-
56
-
57
-
58
-
59
-
60
-
61
-
62
-
63
-
64
-
65
-
66
-
67
-
68
-
69
-
70
-
71
-
72
-
73
-
74
-
75
-
76
-
77
-
78
-
79
-
80
-
81
-
82
-
83
-
84
-
85
-
86
-
87
-
88
-
89
-
90
-
91
-
92
-
93
-
94
-
95
-
96
-
97
-
98
-
99
-
100
-
101
-
102
-
103
-
104
-
105
-
106
-
107
-
108
-
109
-
110
-
111
-
112
-
113
-
114
-
115
-
116
-
117
-
118
-
119
-
120
-
121
-
122
-
123
-
124
-
125
-
126
-
127
-
128
-
129
-
130
-
131
-
132
-
133
-
134
-
135
-
136
-
137
-
138
-
139
-
140
-
141
-
142
-
143
-
144
-
145
-
146
-
147
-
148
-
149
-
150
-
151
-
152
-
153
-
154
-
155
-
156
-
157
-
158
-
159
-
160
-
161
-
162
-
163
-
164
-
165
-
166
-
167
-
168
-
169
-
170
-
171
-
172
-
173
-
174
-
175
-
176
-
177
-
178
-
179
-
180
-
181
-
182
-
183
-
184
-
185
-
186
-
187
-
188
-
189
-
190
-
191
-
192
-
193
-
194
-
195
-
196
-
197
-
198
-
199
-
200
-
201
-
202
-
203
-
204
-
205
-
206
-
207
-
208
-
209
-
210
-
211
-
212
-
213
-
214
-
215
-
216
-
217
-
218
-
219
-
220
-
221
-
222
-
223
-
224
-
225
-
226
-
227
-
228
-
229
-
230
-
231
-
232
-
233
-
234
-
235
-
236
-
237
-
238
-
239
-
240
-
241
-
242
-
243
-
244
-
245
-
246
-
247
-
248
-
249
-
250
-
251
-
252
-
253
-
254
-
255
-
256
-
257
-
258
-
259
-
260
-
261
-
262
-
263
-
 264
264 -
 265
265 -
 266
266 -
 267
267 -
 268
268 -
 269
269 -
 270
270 -
 271
271 -
 272
272 -
 273
273 -
 274
274 -
 275
275 -
 276
276 -
 277
277 -
 278
278 -
 279
279 -
 280
280 -
 281
281 -
 282
282 -
 283
283 -
 284
284 -
285
-
286
-
287
-
288
-
289
-
290
-
291
-
292
-
293
-
294
-
295
-
296
-
297
-
298
-
299
-
300
-
301
-
302
-
303
-
304
-
305
-
306
-
307
-
308
-
309
-
310
-
311
-
312
-
313
-
314
-
315
-
316
-
317
-
318
-
319
-
320
-
321
-
322
-
323
-
324
-
325
-
326
-
327
-
328
-
329
-
330
-
331
-
332
-
333
-
334
-
335
-
336
-
337
-
338
-
339
-
340
-
341
-
342
-
343
-
344
-
345
-
346
-
347
-
348
-
349
-
350
-
351
-
352
-
353
-
354
-
355
-
356
-
357
-
358
-
359
-
360
-
361
-
362
-
363
-
364
-
365
-
366
-
367
-
368
-
369
-
370
-
371
-
372
-
373
-
374
-
375
-
376
-
377
-
378
-
379
-
380
-
381
-
382
-
383
-
384
-
385
-
386
-
387
-
388
-
389
-
390
-
391
-
392
-
393
-
394
-
395
-
396
-
397
-
398
-
399
-
400
-
401
-
402
-
403
-
404
-
405
-
406
-
407
-
408
-
409
-
410
-
411
-
412
-
413
-
414
-
415
-
416
-
417
-
418
-
419
-
420
-
421
-
422
-
423
-
424
-
425
-
426
-
427
-
428
-
429
-
430
-
431
-
432
-
433
-
434
-
435
-
436
-
437
-
438
-
439
-
440
-
441
-
442
-
443
-
444
-
445
-
446
-
447
-
448
-
449
-
450
-
451
-
452
-
453
-
454
-
455
-
456
-
457
-
458
-
459
-
460
-
461
-
462
-
463
-
464
-
465
-
466
-
467
-
468
-
469
-
470
-
471
-
472
 |
 |

HSBC HOLDINGS PLC
Report of the Directors: Risk (continued)
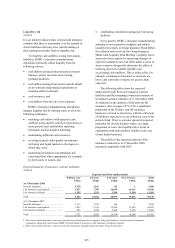
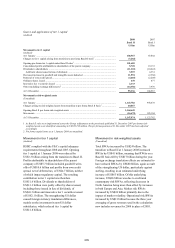
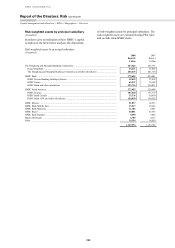
Insurance operations > Financial risks > Liquidity risk // PVIF
272
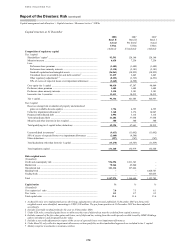
Remaining contractual maturity of investment contract liabilities
(Audited)
Liabilities under investment contracts by
insurance underwriting subsidiaries
Linked
investment
contracts
Other
investment
contracts
Investment
contracts
with DPF
Total
US$m US$m US$m US$m
At 31 December 2008
Remaining contractual maturity:
– due within 1 year ................................................... 178 314 – 492
– due between 1 and 5 years .................................... 610 21 34 665
– due between 5 and 10 years .................................. 482 31 – 513
– due after 10 years .................................................. 1,649 42 – 1,691
– undated1 ................................................................. 3,093 3,147 17,732 23,972
Total2 ............................................................................. 6,012 3,555 17,766 27,333
At 31 December 2007
Remaining contractual maturity:
– due within 1 year ................................................... 286 331 1 618
– due between 1 and 5 years .................................... 1,234 48 28 1,310
– due between 5 and 10 years .................................. 950 – – 950
– due after 10 years .................................................. 3,386 44 – 3,430
– undated1 ................................................................. 6,869 3,217 18,954 29,040
Total3 ............................................................................. 12,725 3,640 18,983 35,348
1 In most cases, policyholders have the option to terminate their contracts at any time and receive the surrender values of their policies.
These may be significantly lower than the amounts shown above.
2 Does not include investment contracts issued by associated insurance company, Ping An Insurance, or joint venture insurance
companies, Hana Life and Canara HSBC Oriental Bank of Commerce Life Insurance Company Limited.
3 Does not include investment contracts issued by insurance manufacturing associate, Ping An Insurance.
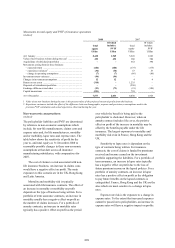
Present value of in-force long-term
insurance business
(Audited)
The HSBC life insurance business is accounted for
using the embedded value approach which, inter
alia, provides a comprehensive framework for the
evaluation of insurance and related risks. The present
value of the in-force long-term (‘PVIF’) asset at
31 December 2008 was US$2.0 billion (2007:
US$2.0 billion). The present value of the
shareholders’ interest in the profits expected to
emerge from the book of in-force policies at
31 December can be stress-tested to assess the ability
of the life business book to withstand adverse
developments. A key feature of the life insurance
business is the importance of managing the assets,
liabilities and risks in a coordinated fashion rather
than individually. This reflects the greater
interdependence of these three elements for life
insurance than is generally the case for non-life
insurance.
The following table shows the effect on the
PVIF of reasonably possible changes in the main
economic assumptions, namely the risk-free and risk
discount rates, across all insurance manufacturing
subsidiaries.
Sensitivity of PVIF to changes in economic
assumptions
(Audited)
PVIF at 31 December
2008 2007
US$m US$m
+ 100 basis point shift in
risk-free rate .............. 179 195
– 100 basis point shift in
risk-free rate .............. (100) (232)
+ 100 basis point shift in
risk discount rate ....... (109) (95)
– 100 basis point shift in
risk discount rate ....... 122 106
Due to certain characteristics of the contracts,
the relationships may be non-linear and the results of
the stress-testing disclosed above should not be
extrapolated to higher levels of stress. In calculating
the various scenarios, all assumptions are held stable
except when testing the effect of the shift in the risk-
free rate, when consequential changes to investment
returns, risk discount rates and bonus rates are also
incorporated. The sensitivities shown are before
actions that could be taken by management to
mitigate effects and before consequential changes in
policyholder behaviour.
The following table shows the movements
recorded during the year in respect of total equity
and PVIF of insurance operations: