HSBC 2008 Annual Report Download - page 102
Download and view the complete annual report
Please find page 102 of the 2008 HSBC annual report below. You can navigate through the pages in the report by either clicking on the pages listed below, or by using the keyword search tool below to find specific information within the annual report.-
 1
1 -
2
-
3
-
4
-
5
-
6
-
7
-
8
-
9
-
10
-
11
-
12
-
13
-
14
-
15
-
16
-
17
-
18
-
19
-
20
-
21
-
22
-
23
-
24
-
25
-
26
-
27
-
28
-
29
-
30
-
31
-
32
-
33
-
34
-
35
-
36
-
37
-
38
-
39
-
40
-
41
-
42
-
43
-
44
-
45
-
46
-
47
-
48
-
49
-
50
-
51
-
52
-
53
-
54
-
55
-
56
-
57
-
58
-
59
-
60
-
61
-
62
-
63
-
64
-
65
-
66
-
67
-
68
-
69
-
70
-
71
-
72
-
73
-
74
-
75
-
76
-
77
-
78
-
79
-
80
-
81
-
82
-
83
-
84
-
85
-
86
-
87
-
88
-
89
-
90
-
91
-
 92
92 -
 93
93 -
 94
94 -
 95
95 -
 96
96 -
 97
97 -
 98
98 -
 99
99 -
 100
100 -
 101
101 -
 102
102 -
 103
103 -
 104
104 -
 105
105 -
 106
106 -
 107
107 -
 108
108 -
 109
109 -
 110
110 -
 111
111 -
 112
112 -
113
-
114
-
115
-
116
-
117
-
118
-
119
-
120
-
121
-
122
-
123
-
124
-
125
-
126
-
127
-
128
-
129
-
130
-
131
-
132
-
133
-
134
-
135
-
136
-
137
-
138
-
139
-
140
-
141
-
142
-
143
-
144
-
145
-
146
-
147
-
148
-
149
-
150
-
151
-
152
-
153
-
154
-
155
-
156
-
157
-
158
-
159
-
160
-
161
-
162
-
163
-
164
-
165
-
166
-
167
-
168
-
169
-
170
-
171
-
172
-
173
-
174
-
175
-
176
-
177
-
178
-
179
-
180
-
181
-
182
-
183
-
184
-
185
-
186
-
187
-
188
-
189
-
190
-
191
-
192
-
193
-
194
-
195
-
196
-
197
-
198
-
199
-
200
-
201
-
202
-
203
-
204
-
205
-
206
-
207
-
208
-
209
-
210
-
211
-
212
-
213
-
214
-
215
-
216
-
217
-
218
-
219
-
220
-
221
-
222
-
223
-
224
-
225
-
226
-
227
-
228
-
229
-
230
-
231
-
232
-
233
-
234
-
235
-
236
-
237
-
238
-
239
-
240
-
241
-
242
-
243
-
244
-
245
-
246
-
247
-
248
-
249
-
250
-
251
-
252
-
253
-
254
-
255
-
256
-
257
-
258
-
259
-
260
-
261
-
262
-
263
-
264
-
265
-
266
-
267
-
268
-
269
-
270
-
271
-
272
-
273
-
274
-
275
-
276
-
277
-
278
-
279
-
280
-
281
-
282
-
283
-
284
-
285
-
286
-
287
-
288
-
289
-
290
-
291
-
292
-
293
-
294
-
295
-
296
-
297
-
298
-
299
-
300
-
301
-
302
-
303
-
304
-
305
-
306
-
307
-
308
-
309
-
310
-
311
-
312
-
313
-
314
-
315
-
316
-
317
-
318
-
319
-
320
-
321
-
322
-
323
-
324
-
325
-
326
-
327
-
328
-
329
-
330
-
331
-
332
-
333
-
334
-
335
-
336
-
337
-
338
-
339
-
340
-
341
-
342
-
343
-
344
-
345
-
346
-
347
-
348
-
349
-
350
-
351
-
352
-
353
-
354
-
355
-
356
-
357
-
358
-
359
-
360
-
361
-
362
-
363
-
364
-
365
-
366
-
367
-
368
-
369
-
370
-
371
-
372
-
373
-
374
-
375
-
376
-
377
-
378
-
379
-
380
-
381
-
382
-
383
-
384
-
385
-
386
-
387
-
388
-
389
-
390
-
391
-
392
-
393
-
394
-
395
-
396
-
397
-
398
-
399
-
400
-
401
-
402
-
403
-
404
-
405
-
406
-
407
-
408
-
409
-
410
-
411
-
412
-
413
-
414
-
415
-
416
-
417
-
418
-
419
-
420
-
421
-
422
-
423
-
424
-
425
-
426
-
427
-
428
-
429
-
430
-
431
-
432
-
433
-
434
-
435
-
436
-
437
-
438
-
439
-
440
-
441
-
442
-
443
-
444
-
445
-
446
-
447
-
448
-
449
-
450
-
451
-
452
-
453
-
454
-
455
-
456
-
457
-
458
-
459
-
460
-
461
-
462
-
463
-
464
-
465
-
466
-
467
-
468
-
469
-
470
-
471
-
472
 |
 |

HSBC HOLDINGS PLC
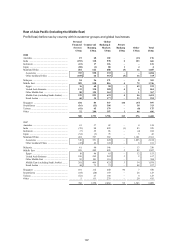
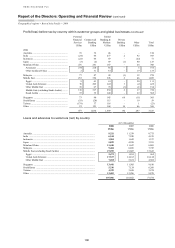
Report of the Directors: Operating and Financial Review (continued)
Geographical regions > Hong Kong > 2008 / 2007
100
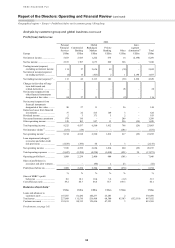
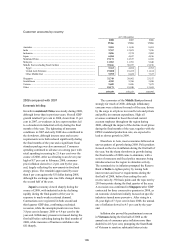
2008 compared with 2007
Economic briefing
Hong Kong’s GDP growth slowed to 2.5 per cent in
2008 from 6.4 per cent in 2007. After performing
strongly during the early months of the year, the
economy slowed sharply and a technical recession
was confirmed with the release of the third quarter
GDP statistics. External demand proved especially
weak during the second half of 2008 and the growth
in private consumption also slowed sharply. The
unemployment rate rose from a ten-year low of
3.2 per cent in August 2008 to 4.1 per cent by the
year-end. Consumer price inflation proved volatile
during the year, rising to a ten-year high of 6.3 per
cent in July before slowing to 2.1 per cent by
December 2008, although this movement largely
reflected the trends in food and energy prices. In
response to interest rate cuts in the US, Hong Kong
cut its base interest rate on seven occasions during
2008, finishing the year at 0.5 per cent compared
with 5.75 per cent at the end of 2007. The Hang
Seng Index fell by 48 per cent during 2008.
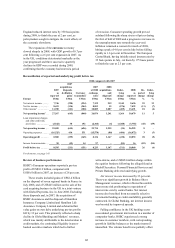
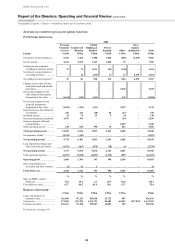
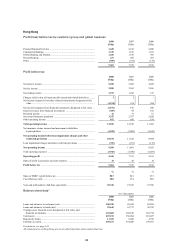
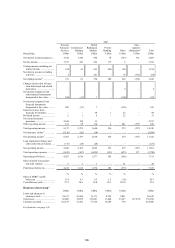
Reconciliation of reported and underlying profit before tax
2008 compared with 2007
Hong Kong
2007
as
reported
US$m
2007
acquisitions,
disposals
& dilution
gains1
US$m
Currency
translation2
US$m
2007
at 2008
exchange
rates3
US$m
2008
acquisitions
and
disposals1
US$m
Under-
lying
change
US$m
2008
as
reported
US$m
Re-
ported
change
%
Under-
lying
change
%
Net interest income .......... 5,483 – 15 5,498 – 200 5,698 4 4
Net fee income ................. 3,362 – 9 3,371 –
(791) 2,580 (23) (23)
Other income4................... 2,477 (1) 3 2,479 – (603) 1,876 (24) (24)
Net operating income5.... 11,322 (1) 27 11,348 – (1,194) 10,154 (10) (11)
Loan impairment charges
and other credit risk
provisions .................... (231) 1 (1) (231) – (534) (765) (231) (231)
Net operating income .... 11,091 – 26 11,117 – (1,728) 9,389 (15) (16)
Operating expenses .......... (3,780) – (9) (3,789) – (154) (3,943) (4) (4)
Operating profit ............. 7,311 – 17 7,328 – (1,882) 5,446 (26) (26)
Income from associates ... 28 – – 28 – (13) 15 (46) (46)
Profit before tax ............. 7,339 – 17 7,356 – (1,895) 5,461 (26) (26)
For footnotes, see page 143.
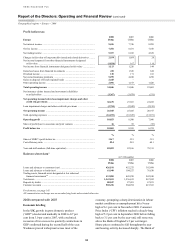
Review of business performance
Hong Kong reported pre-tax profits of
US$5.5 billion, a 26 per cent decline compared with
record profits of US$7.3 billion in 2007. Lower
revenues largely reflected a decline in wealth
management and insurance income as economic
conditions deteriorated. Revenue decline was
compounded by impairment charges recognised on
certain investments, which arose as a consequence of
significant falls in equity market prices. Offsetting
this, in part, was considerably stronger balance sheet
management income from treasury positions which
correctly anticipated the decline in interest rates.
Net interest income rose by 4 per cent, driven by
the strong Balance Sheet Management performance
in Global Banking and Markets mainly driven by
liquidity generated by retail banking in the
environment of falling short-term interest rates.
Savings and deposit balances grew strongly,
particularly in Personal Financial Services, as
customers revealed a preference for security and
liquidity following declines in equity markets.
Deposit growth was augmented by the launch of
campaigns offering both preferential time deposit
rates and an enhanced HSBC online platform. The
significant decline in interest rates during 2008 led to
a narrowing of deposit spreads.
Customer lending volumes were 11 per cent
higher, due in part to an 11 per cent rise in mortgage
balances. Lending margins narrowed, however, due
to interest rate cuts, particularly affecting mortgage
lending and other loans linked to HIBOR. Balances
outstanding on credit cards rose, driven by increased
cardholder spending, and spreads on this business
increased due to lower funding costs. Nearly one
million new cards were issued in the year, bringing
the total cards in circulation to 5.3 million. Volumes