HSBC 2008 Annual Report Download - page 32
Download and view the complete annual report
Please find page 32 of the 2008 HSBC annual report below. You can navigate through the pages in the report by either clicking on the pages listed below, or by using the keyword search tool below to find specific information within the annual report.-
 1
1 -
2
-
3
-
4
-
5
-
6
-
7
-
8
-
9
-
10
-
11
-
12
-
13
-
14
-
15
-
16
-
17
-
18
-
19
-
20
-
21
-
 22
22 -
 23
23 -
 24
24 -
 25
25 -
 26
26 -
 27
27 -
 28
28 -
 29
29 -
 30
30 -
 31
31 -
 32
32 -
 33
33 -
 34
34 -
 35
35 -
 36
36 -
 37
37 -
 38
38 -
 39
39 -
 40
40 -
 41
41 -
 42
42 -
43
-
44
-
45
-
46
-
47
-
48
-
49
-
50
-
51
-
52
-
53
-
54
-
55
-
56
-
57
-
58
-
59
-
60
-
61
-
62
-
63
-
64
-
65
-
66
-
67
-
68
-
69
-
70
-
71
-
72
-
73
-
74
-
75
-
76
-
77
-
78
-
79
-
80
-
81
-
82
-
83
-
84
-
85
-
86
-
87
-
88
-
89
-
90
-
91
-
92
-
93
-
94
-
95
-
96
-
97
-
98
-
99
-
100
-
101
-
102
-
103
-
104
-
105
-
106
-
107
-
108
-
109
-
110
-
111
-
112
-
113
-
114
-
115
-
116
-
117
-
118
-
119
-
120
-
121
-
122
-
123
-
124
-
125
-
126
-
127
-
128
-
129
-
130
-
131
-
132
-
133
-
134
-
135
-
136
-
137
-
138
-
139
-
140
-
141
-
142
-
143
-
144
-
145
-
146
-
147
-
148
-
149
-
150
-
151
-
152
-
153
-
154
-
155
-
156
-
157
-
158
-
159
-
160
-
161
-
162
-
163
-
164
-
165
-
166
-
167
-
168
-
169
-
170
-
171
-
172
-
173
-
174
-
175
-
176
-
177
-
178
-
179
-
180
-
181
-
182
-
183
-
184
-
185
-
186
-
187
-
188
-
189
-
190
-
191
-
192
-
193
-
194
-
195
-
196
-
197
-
198
-
199
-
200
-
201
-
202
-
203
-
204
-
205
-
206
-
207
-
208
-
209
-
210
-
211
-
212
-
213
-
214
-
215
-
216
-
217
-
218
-
219
-
220
-
221
-
222
-
223
-
224
-
225
-
226
-
227
-
228
-
229
-
230
-
231
-
232
-
233
-
234
-
235
-
236
-
237
-
238
-
239
-
240
-
241
-
242
-
243
-
244
-
245
-
246
-
247
-
248
-
249
-
250
-
251
-
252
-
253
-
254
-
255
-
256
-
257
-
258
-
259
-
260
-
261
-
262
-
263
-
264
-
265
-
266
-
267
-
268
-
269
-
270
-
271
-
272
-
273
-
274
-
275
-
276
-
277
-
278
-
279
-
280
-
281
-
282
-
283
-
284
-
285
-
286
-
287
-
288
-
289
-
290
-
291
-
292
-
293
-
294
-
295
-
296
-
297
-
298
-
299
-
300
-
301
-
302
-
303
-
304
-
305
-
306
-
307
-
308
-
309
-
310
-
311
-
312
-
313
-
314
-
315
-
316
-
317
-
318
-
319
-
320
-
321
-
322
-
323
-
324
-
325
-
326
-
327
-
328
-
329
-
330
-
331
-
332
-
333
-
334
-
335
-
336
-
337
-
338
-
339
-
340
-
341
-
342
-
343
-
344
-
345
-
346
-
347
-
348
-
349
-
350
-
351
-
352
-
353
-
354
-
355
-
356
-
357
-
358
-
359
-
360
-
361
-
362
-
363
-
364
-
365
-
366
-
367
-
368
-
369
-
370
-
371
-
372
-
373
-
374
-
375
-
376
-
377
-
378
-
379
-
380
-
381
-
382
-
383
-
384
-
385
-
386
-
387
-
388
-
389
-
390
-
391
-
392
-
393
-
394
-
395
-
396
-
397
-
398
-
399
-
400
-
401
-
402
-
403
-
404
-
405
-
406
-
407
-
408
-
409
-
410
-
411
-
412
-
413
-
414
-
415
-
416
-
417
-
418
-
419
-
420
-
421
-
422
-
423
-
424
-
425
-
426
-
427
-
428
-
429
-
430
-
431
-
432
-
433
-
434
-
435
-
436
-
437
-
438
-
439
-
440
-
441
-
442
-
443
-
444
-
445
-
446
-
447
-
448
-
449
-
450
-
451
-
452
-
453
-
454
-
455
-
456
-
457
-
458
-
459
-
460
-
461
-
462
-
463
-
464
-
465
-
466
-
467
-
468
-
469
-
470
-
471
-
472
 |
 |

HSBC HOLDINGS PLC
Report of the Directors: Operating and Financial Review (continued)
Financial summary > Group performance > Gains less losses from financial investments / Dilution gains / Net earned insurance premiums
30
For assets held to meet liabilities under
investment contracts the corresponding reduction in
the liability to customers is also reported within net
income from financial instruments designated at fair
value. A reduction of US$1.8 billion in the movement
in fair value of liabilities held under investment
contracts compared with an increase in the fair value
of liabilities of US$940 million in 2007.
2007 compared with 2006
Credit spreads widened significantly in the second
half of 2007, leading to a substantial increase in net
income from financial instruments designated at fair
value compared with 2006. This was primarily
driven by a widening in credit spreads on certain
fixed-rate long-term debt issued by HSBC Holdings
and its subsidiaries. These cumulative gains
will fully reverse over the life of the debt. The
cumulative adjustments to reserves (when the policy
is applied for the first time) and the income
statement (subsequent applications of the policy),
reflecting the change in own credit spread since the
fair value option was available, was US$1.6 billion
after taking into account the US$3.1 billion credit
in 2007.
Income from assets held to meet liabilities under
insurance and investment contracts also rose, by
32 per cent, reflecting primarily premium growth
and higher investment returns on the portfolios held
by the insurance businesses in the UK and Hong
Kong. The change in fair value of liabilities under
investment contracts declined by 7 per cent.
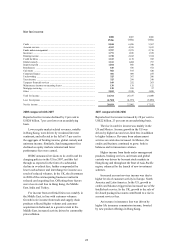
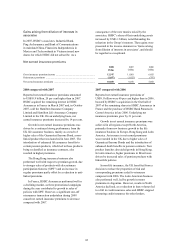
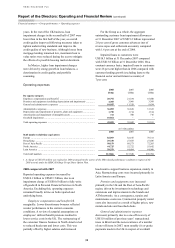
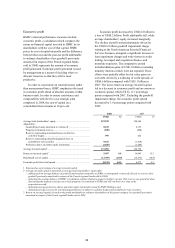
Gains less losses from financial investments
2008
US$m
2007
US$m
2006
US$m
Net gain from disposal of:
– debt securities ........................................................................................... 19 120 252
– equity securities ........................................................................................ 1,216 1,864 702
– other financial investments ...................................................................... 4 14 15
1,239 1,998 969
Impairment of available-for-sale equity securities .......................................... (1,042) (42) –
Gains less losses from financial investments .................................................. 197 1,956 969
2008 compared 2007
Reported gains less losses of US$197 million from
financial investments during 2008 were 90 per cent
lower than in 2007, 93 per cent lower on an
underlying basis. A reduction in net gains from
disposals was compounded by significant
impairments recognised on equity securities held in
the available-for-sale portfolio as certain investments
were marked down to reflect the prevailing market
conditions.
The redemption of Visa Inc. (‘Visa’) shares
following its IPO resulted in significant gains, and
there were further gains from the sale of MasterCard
Inc. (‘MasterCard’) shares. These were more than
offset by losses in Principal Investments and the
non-recurrence of various significant gains in 2007,
mostly in respect of Euronext, the European stock
exchange, and a credit bureau in Brazil.
Declining equity markets caused impairments
to be recognised against a number of strategic
investments in Asia, held in the available-for-sale
portfolio and on private equity investments, mainly
in Europe. The market turmoil in the US also led to
impairments against investments in various US
financial institutions.
2007 compared with 2006
Net gains of US$2.0 billion were reported by HSBC
as a result of the disposal of financial investments
during 2007, a two-fold increase over 2006 and
93 per cent higher on an underlying basis.
The increase was driven by the sale of shares
and various equity investments in all regions,
including holdings in Euronext (the European stock
exchange), MasterCard in North America and a
credit bureau in Brazil. In Private Banking, a gain
of US$91 million arose from the sale of a further
holding in the Hermitage Fund, compared with
US$117 million in 2006. The gains in 2007 were
marginally offset by the non-recurrence of a
US$101 million gain on the sale of part of HSBC’s
stake in UTI Bank Limited in 2006.