HSBC 2008 Annual Report Download - page 370
Download and view the complete annual report
Please find page 370 of the 2008 HSBC annual report below. You can navigate through the pages in the report by either clicking on the pages listed below, or by using the keyword search tool below to find specific information within the annual report.-
 1
1 -
2
-
3
-
4
-
5
-
6
-
7
-
8
-
9
-
10
-
11
-
12
-
13
-
14
-
15
-
16
-
17
-
18
-
19
-
20
-
21
-
22
-
23
-
24
-
25
-
26
-
27
-
28
-
29
-
30
-
31
-
32
-
33
-
34
-
35
-
36
-
37
-
38
-
39
-
40
-
41
-
42
-
43
-
44
-
45
-
46
-
47
-
48
-
49
-
50
-
51
-
52
-
53
-
54
-
55
-
56
-
57
-
58
-
59
-
60
-
61
-
62
-
63
-
64
-
65
-
66
-
67
-
68
-
69
-
70
-
71
-
72
-
73
-
74
-
75
-
76
-
77
-
78
-
79
-
80
-
81
-
82
-
83
-
84
-
85
-
86
-
87
-
88
-
89
-
90
-
91
-
92
-
93
-
94
-
95
-
96
-
97
-
98
-
99
-
100
-
101
-
102
-
103
-
104
-
105
-
106
-
107
-
108
-
109
-
110
-
111
-
112
-
113
-
114
-
115
-
116
-
117
-
118
-
119
-
120
-
121
-
122
-
123
-
124
-
125
-
126
-
127
-
128
-
129
-
130
-
131
-
132
-
133
-
134
-
135
-
136
-
137
-
138
-
139
-
140
-
141
-
142
-
143
-
144
-
145
-
146
-
147
-
148
-
149
-
150
-
151
-
152
-
153
-
154
-
155
-
156
-
157
-
158
-
159
-
160
-
161
-
162
-
163
-
164
-
165
-
166
-
167
-
168
-
169
-
170
-
171
-
172
-
173
-
174
-
175
-
176
-
177
-
178
-
179
-
180
-
181
-
182
-
183
-
184
-
185
-
186
-
187
-
188
-
189
-
190
-
191
-
192
-
193
-
194
-
195
-
196
-
197
-
198
-
199
-
200
-
201
-
202
-
203
-
204
-
205
-
206
-
207
-
208
-
209
-
210
-
211
-
212
-
213
-
214
-
215
-
216
-
217
-
218
-
219
-
220
-
221
-
222
-
223
-
224
-
225
-
226
-
227
-
228
-
229
-
230
-
231
-
232
-
233
-
234
-
235
-
236
-
237
-
238
-
239
-
240
-
241
-
242
-
243
-
244
-
245
-
246
-
247
-
248
-
249
-
250
-
251
-
252
-
253
-
254
-
255
-
256
-
257
-
258
-
259
-
260
-
261
-
262
-
263
-
264
-
265
-
266
-
267
-
268
-
269
-
270
-
271
-
272
-
273
-
274
-
275
-
276
-
277
-
278
-
279
-
280
-
281
-
282
-
283
-
284
-
285
-
286
-
287
-
288
-
289
-
290
-
291
-
292
-
293
-
294
-
295
-
296
-
297
-
298
-
299
-
300
-
301
-
302
-
303
-
304
-
305
-
306
-
307
-
308
-
309
-
310
-
311
-
312
-
313
-
314
-
315
-
316
-
317
-
318
-
319
-
320
-
321
-
322
-
323
-
324
-
325
-
326
-
327
-
328
-
329
-
330
-
331
-
332
-
333
-
334
-
335
-
336
-
337
-
338
-
339
-
340
-
341
-
342
-
343
-
344
-
345
-
346
-
347
-
348
-
349
-
350
-
351
-
352
-
353
-
354
-
355
-
356
-
357
-
358
-
359
-
 360
360 -
 361
361 -
 362
362 -
 363
363 -
 364
364 -
 365
365 -
 366
366 -
 367
367 -
 368
368 -
 369
369 -
 370
370 -
 371
371 -
 372
372 -
 373
373 -
 374
374 -
 375
375 -
 376
376 -
 377
377 -
 378
378 -
 379
379 -
 380
380 -
381
-
382
-
383
-
384
-
385
-
386
-
387
-
388
-
389
-
390
-
391
-
392
-
393
-
394
-
395
-
396
-
397
-
398
-
399
-
400
-
401
-
402
-
403
-
404
-
405
-
406
-
407
-
408
-
409
-
410
-
411
-
412
-
413
-
414
-
415
-
416
-
417
-
418
-
419
-
420
-
421
-
422
-
423
-
424
-
425
-
426
-
427
-
428
-
429
-
430
-
431
-
432
-
433
-
434
-
435
-
436
-
437
-
438
-
439
-
440
-
441
-
442
-
443
-
444
-
445
-
446
-
447
-
448
-
449
-
450
-
451
-
452
-
453
-
454
-
455
-
456
-
457
-
458
-
459
-
460
-
461
-
462
-
463
-
464
-
465
-
466
-
467
-
468
-
469
-
470
-
471
-
472
 |
 |

HSBC HOLDINGS PLC
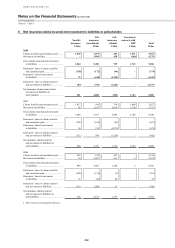
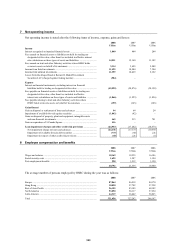
Notes on the Financial Statements (continued)
Note 8
368
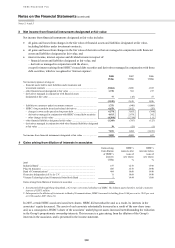
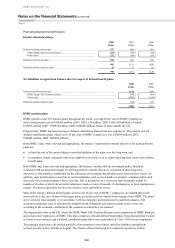
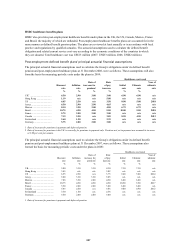
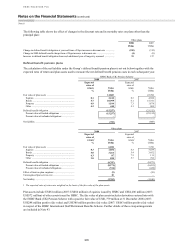
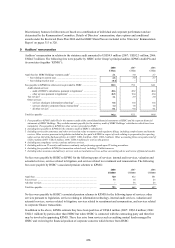
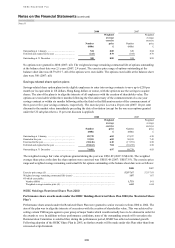
The principal actuarial financial assumptions used to calculate the Group’s obligations under its defined benefit
pension and post-employment healthcare plans at 31 December 2006, were as follows. These assumptions also
formed the basis for measuring periodic costs under the plans in 2007:
Healthcare cost trend
Discount
rate
Inflation
rate
Rate of
increase for
pensions1
Rate
of pay
increase
Initial
rate
Ultimate
rate
Year of
ultimate
rate
% % % % % %
UK .......................................... 5.10 3.00 3.00 4.00 7.00 7.00 n/a
Hong Kong ............................ 3.75 n/a n/a 3.00 n/a n/a n/a
US .......................................... 5.90 2.50 n/a 3.75 10.50 5.00 2014
Jersey ..................................... 5.10 3.00 3.00 4.75 n/a n/a n/a
Mexico ................................... 8.00 3.50 2.00 4.00 6.75 6.75 n/a
Brazil ...................................... 10.75 4.50 4.50 4.50 11.00 5.50 2016
France .................................... 4.50 2.00 2.00 3.00 6.00 6.00 n/a
Canada ................................... 5.19 2.50 n/a 3.47 9.90 4.90 2012
Switzerland ............................ 2.25 1.50 n/a 2.25 n/a n/a n/a
Germany ................................. 4.50 2.00 2.00 3.00 n/a n/a n/a
1 Rate of increase for pensions in payment and deferred pension.
HSBC determines the discount rates to be applied to its obligations in consultation with the plans’ local actuaries,
on the basis of current average yields of high quality (AA rated or equivalent) debt instruments, with maturities
consistent with those of the defined benefit obligations. In countries where there is no deep market in corporate
bonds, government bond yields have been used. The yield curve has been extrapolated where the term of the
liabilities is longer than the duration of available bonds and the discount rate used then takes into account the term
of the liabilities and the shape of the yield curve.
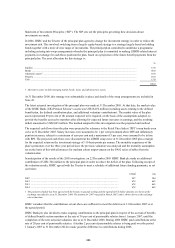
When determining the discount rate with reference to a bond index, an appropriate index for the specific region has
been used. The expected return on plan assets represents the best estimate of long-term future asset returns, which
takes into account historical market returns plus additional factors such as the current rate of inflation and interest
rates.
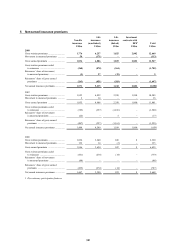
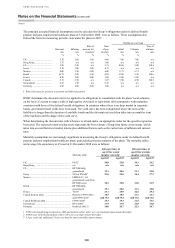
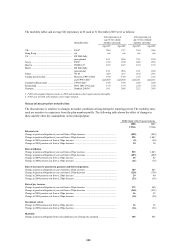
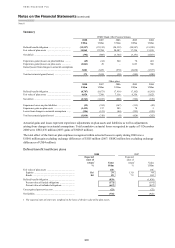
Mortality assumptions are increasingly significant in measuring the Group’s obligations under its defined benefit
pension and post-employment healthcare plans, particularly given the maturity of the plans. The mortality tables
and average life expectancy at 65 used at 31 December 2008 were as follows:
Mortality table
Life expectancy at
age 65 for a male
member currently:
Life expectancy at
age 65 for a female
member currently:
Aged 65 Aged 45 Aged 65 Aged 45
UK .......................................................................... PA921 20.8 22.8 24.1 26.2
Hong Kong ............................................................ n/a n/a n/a n/a n/a
US .......................................................................... RP 2000 fully
generational 19.1 20.6 21.1 22.0
Jersey ..................................................................... 90% of PNA002 23.0 25.0 25.4 27.3
Mexico ................................................................... EMSSA-97, AA
generational scale from
RP 2000 series 18.3
19.8 21.0 21.9
Brazil ...................................................................... RP 2000 fully
generational 19.1
20.6 21.1 22.0
France .................................................................... TG 05 23.1 25.9 26.6 29.4
Canada pension plans ............................................ Between UP94 C2015
and UP94 C2027
18.5
and 19.4
18.5
and 19.4
21.1
and 21.6
21.1
and 21.6
Canada healthcare plan .......................................... UP94 C2025 19.3 19.3 21.5 21.5
Switzerland ............................................................ BVG 20053 17.9 17.9 21.0 21.0
Germany ................................................................. Heubeck 2005 G 18.0 20.7 22.1 24.7
1 PA92 with standard improvements to 2005 and medium cohort with 1 per cent minimum improvement thereafter.
2 PNA00 year of birth and medium cohort with 1 per cent improvement thereafter.
3 3.5 per cent load, additional 5.0 per cent load for future mortality improvements.